
Page 1756 - Hall et al (2015) Principles of Critical Care-McGraw-Hill
P. 1756
CHAPTER 125: Critical Care Pharmacology 1225
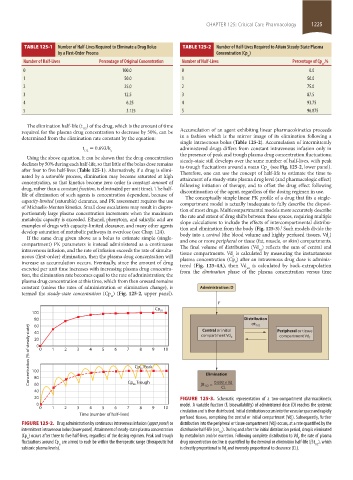
TABLE 125-1 Number of Half-Lives Required to Eliminate a Drug Bolus TABLE 125-2 Number of Half-Lives Required to Attain Steady-State Plasma
by a First-Order Process Concentration (Cp )
ss
Number of Half-Lives Percentage of Original Concentration Number of Half-Lives Percentage of Cp ,%
ss
0 100.0 0 0.0
1 50.0 1 50.0
2 25.0 2 75.0
3 12.5 3 87.5
4 6.25 4 93.75
5 3.125 5 96.875
The elimination half-life (t ) of the drug, which is the amount of time
1/2
required for the plasma drug concentration to decrease by 50%, can be Accumulation of an agent exhibiting linear pharmacokinetics proceeds
determined from the elimination rate constant by the equation: in a fashion which is the mirror image of its elimination following a
single intravenous bolus (Table 125-2). Accumulation of intermittently
t = 0.693/k administered drugs differs from constant intravenous infusion only in
1/2 e
Using the above equation, it can be shown that the drug concentration the presence of peak and trough plasma drug concentration fluctuations;
steady-state still develops over the same number of half-lives, with peak
declines by 50% during each half-life, so that little of the bolus dose remains to-trough fluctuations around a mean Cp (see Fig. 125-2, lower panel).
after four to five half-lives (Table 125-1). Alternatively, if a drug is elimi- Therefore, one can use the concept of half-life to estimate the time to
ss
nated by a saturable process, elimination may become saturated at high attainment of a steady-state plasma drug level (and pharmacologic effect)
concentration, so that kinetics become zero order (a constant amount of following initiation of therapy, and to offset the drug effect following
drug, rather than a constant fraction, is eliminated per unit time). The half- discontinuation of the agent, regardless of the dosing regimen in use.
life of elimination of such agents is concentration dependent, because of The conceptually simple linear PK profile of a drug that fits a single-
capacity-limited (saturable) clearance, and PK assessment requires the use compartment model is actually inadequate to fully describe the disposi-
of Michaelis-Menten kinetics. Small dose escalations may result in dispro- tion of most drugs. Multicompartmental models more accurately describe
portionately large plasma concentration increments when the maximum the rate and extent of drug shifts between these spaces, requiring multiple
metabolic capacity is exceeded. Ethanol, phenytoin, and salicylic acid are slope calculations to include the effects of intercompartmental distribu-
examples of drugs with capacity-limited clearance, and many other agents tion and elimination from the body (Fig. 125-3). Such models divide the
3
develop saturation of metabolic pathways in overdose (see Chap. 124). body into a central (the blood volume and highly perfused tissues, Vd )
If the same drug given above as a bolus to estimate simple (single- c
compartment) PK parameters is instead administered as a continuous and one or more peripheral or tissue (fat, muscle, or skin) compartments.
The final volume of distribution (Vd ) reflects the sum of central and
intravenous infusion, and the rate of infusion exceeds the rate of simulta- tissue compartments. Vd is calculated by measuring the instantaneous
tot
neous (first-order) elimination, then the plasma drug concentration will plasma concentration (Cp ) after an intravenous drug dose is adminis-
c
increase as accumulation occurs. Eventually, since the amount of drug tered (Fig. 125-4A), then Vd is calculated by back-extrapolation
0
excreted per unit time increases with increasing plasma drug concentra- from the elimination phase of the plasma concentration versus time
tot
tion, the elimination rate becomes equal to the rate of administration; the
plasma drug concentration at this time, which from then onward remains
constant (unless the rates of administration or elimination change), is Administration: D
termed the steady-state concentration (Cp ) (Fig. 125-2, upper panel).
ss
F
Cp ss
100
80 compartment Vd c Distribution Peripheral or tissue
60
αt 1/2
Concentration (% of steady state) 20 0 0 1 2 3 4 5 6 7 Cp ss Peak 9 10 compartment Vd t
Central or initial
40
8
100
Elimination
80
0.693 × Vd
Cp ss Trough
βt 1/2 =
60
CL
40
20 FIGURE 125-3. Schematic representation of a two-compartment pharmacokinetic
0 model. A variable fraction (F, bioavailability) of administered dose (D) reaches the systemic
0 1 2 3 4 5 6 7 8 9 10 circulation and is then distributed. Initial distribution occurs into the vascular space and rapidly
Time (number of half-lives)
perfused tissues, comprising the central or initial compartment (Vd ). Subsequently, further
c
FIGURE 125-2. Drug administration by continuous intravenous infusion (upper panel) or distribution into the peripheral or tissue compartment (Vd) occurs, at a rate quantified by the
t
intermittent intravenous bolus (lower panel). Attainment of steady-state plasma concentration distribution half-life (αt ). During and after the initial distribution period, drug is eliminated
1/2
(Cp ) occurs after three to five half-lives, regardless of the dosing regimen. Peak and trough by metabolism and/or excretion. Following complete distribution to Vd, the rate of plasma
t
ss
fluctuations around Cp are aimed to each be within the therapeutic range (therapeutic but drug concentration decline is quantified by the terminal or elimination half-life (βt ), which
1/2
ss
subtoxic plasma levels). is directly proportional to Vd and inversely proportional to clearance (CL).
t
section11.indd 1225 1/19/2015 10:52:07 AM