
Page 1755 - Hall et al (2015) Principles of Critical Care-McGraw-Hill
P. 1755
1224 PART 11: Special Problems in Critical Care
therapeutic index and readily measurable plasma concentrations that are Vd (the apparent volume of distribution) may be calculated: Vd = D/C,
proportional to drug effects (therapeutic and toxic). Finally, any change since C = D/Vd. By assuming instantaneous distribution and concen-
in the status of an ICU patient must be considered to be potentially the tration sampling (before any elimination has occurred), this model
result of an adverse drug reaction, especially in the absence of a clear-cut describes the theoretical volume into which the administered drug must
explanation. be distributed in order to produce the observed drug concentration
(Fig. 125-1A). The volume of distribution of most drugs does not usu-
PHARMACOKINETIC ally correspond to a physiologic volume (such as the extracellular fluid
AND PHARMACODYNAMIC PRINCIPLES volume [0.2 L/kg] or total body water space [0.5 to 0.7 L/kg]), but is often
many times larger than the total body volume; drugs with a large volume
Pharmacokinetics is the study of drug movement through the body, of distribution are usually characterized by low plasma protein binding,
2-7
encompassing all aspects of drug disposition (“what the body does to high lipid solubility, and extensive tissue binding.
the drug”), including (1) entry, (2) distribution, and (3) elimination. The Drugs whose disposition may be described by a one-compartment
three most important quantifiable PK parameters considered in evaluat- kinetic model exhibit log-linear plasma concentrations as a function
ing the disposition of a drug are therefore (1) bioavailability (fraction of time, thus exhibiting “simple” or “linear” pharmacokinetics (see
of administered dose reaching the systemic circulation), (2) volume of Fig. 125-1B). Since the absolute rate of drug elimination is a linear func-
distribution, and (3) clearance (elimination by biotransformation and/ tion of its plasma concentration, and the fraction of drug eliminated per
or excretion). Pharmacokinetic models divide the body into one or more unit time is constant, a “first-order” kinetic model applies. Following
compartments (see below), so that drug disposition may be described by a single intravenous bolus (and assumed instantaneous complete dis-
a series of mathematical equations. Pharmacodynamics refers to the rela- tribution), plasma drug concentration declines owing to a first-order
tionship of drug movement to pharmacologic response (“what the drug elimination process (biotransformation and/or excretion), so that a
does to the body”). The relationship between PK data and the PD phe- semilogarithmic plot of the logarithm of plasma drug concentration (log
nomenon of drug effect is based on the drug-receptor complex theory, Cp) versus time yields a linear graph. Back-extrapolation of this graph to
which states that there is a correlation between drug concentrations in time zero permits estimation of the plasma drug concentration immedi-
the plasma and at the receptor site, and that drug effect is proportional ately following the bolus (Cp ), and thus an estimate of Vd, since Vd =
0
to the extent of drug-receptor complex formation. D/C. The slope of this plot is called the elimination rate constant k (or k ).
■ BIOAVAILABILITY described by the equation:
e
The kinetics of drug elimination by this first-order process are
The fraction of administered drug reaching the systemic circulation Cp = Cp e –k(T2 – T1)
is termed its bioavailability. Intravascular injection generally results (T2) (T1)
in 100% bioavailability. Other parenteral routes (intramuscular, sub- where Cp (T2) and Cp (T1) are the plasma drug concentrations at later and
cutaneous, transdermal, intraperitoneal, and inhalational) and enteral earlier measurement points, respectively; T2 − T1 is the time elapsed
(oral, through enteral feeding tubes, and rectal) of administration often between these two time points; and k is the elimination rate constant
achieve bioavailability which is both less complete and less predictable, (in units of time ).
–1
although selected agents administered by the sublingual, inhalational,
and other routes may undergo extensive and rapid absorption. Formulation
properties (eg, elixir vs tablet) and the physicochemical properties A 70 B 100
(eg, lipid solubility and degree of ionization at gastric pH) of the admin-
istered drug can substantially affect systemic bioavailability, particularly 60
following enteral administration. Enterally administered agents, except
drugs administered by sublingual or rectal routes, are uniquely subjected Half-life = 2 hours
to the potential influence of first-pass (presystemic) metabolism of drug 50
by gut flora and by intestinal and liver enzymes (see below), which tends
to decrease the systemic bioavailability of the parent compound. 4,6,8 40
Presystemic metabolism may result in the production of metabo- Plasma concentration (Cp, g/mL) Log Cp 10
lites that are inactive (eg, most propranolol metabolites), or active 30
(4-hydroxypropranolol from propranolol, morphine from codeine, or
enalaprilat from enalapril) following enteral substrate administration. 20
Agents requiring metabolism to an active metabolite to elicit pharma-
cologic response, such as enalapril and codeine, are commonly referred
to as prodrugs. Locally administered drugs (eg, intraperitoneal antibiot- 10
ics for peritonitis or intraocular β-blocking agents for glaucoma) are
intended for local effects, but it is important to remember the potential 0 1
systemic absorption and systemic effects of these drugs. In addition to 0 2 4 6 8 10 0 2 4 6 8 10
the factors that determine extent of absorption, drug formulation can be Time (hours)
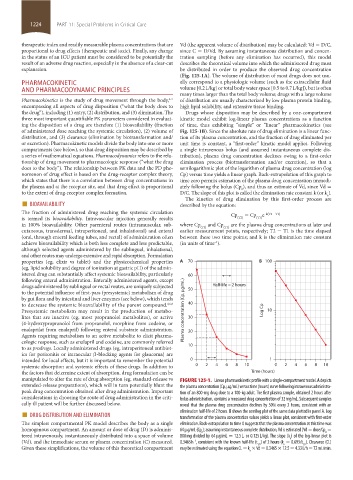
manipulated to alter the rate of drug absorption (eg, standard-release vs FIGURE 125-1. Linear pharmacokinetic profile with a single-compartment model. A depicts
extended-release preparations), which will in turn potentially blunt the the plasma concentration (Cp, µg/mL) versus time (hours) curve following intravenous administra-
peak drug concentration obtained after drug administration. Important tion of an 800-mg drug dose to a 100-kg adult. The first plasma sample, obtained 2 hours after
considerations in choosing the route of drug administration in the criti- bolus administration, contains a measured drug concentration of 32 mg/mL. Subsequent samples
cally ill patient will be further discussed below. reveal that the plasma drug concentration declines by 50% every 2 hours, consistent with an
■ DRUG DISTRIBUTION AND ELIMINATION elimination half-life of 2 hours. B shows the semilog plot of the same data plotted in panel A. Log
The simplest compartmental PK model describes the body as a single transformation of the plasma concentration values yields a linear plot, consistent with first-order
elimination. Back-extrapolation to time 0 suggests that the plasma concentration at this time was
homogenous compartment. An amount or dose of drug (D) is adminis- 64 µg/mL (Cp ); assuming instantaneous complete distribution, Vd is estimated (Vd = dose/Cp =
0
0
tered intravenously, instantaneously distributed into a space of volume 800 mg divided by 64 µg/mL = 12.5 L, or 0.125 L/kg). The slope (k ) of the log-linear plot is
e
(Vd), and the immediate serum or plasma concentration (C) measured. 0.3465 h , consistent with the known half-life (t ) of 2 hours (k = 0.693/t ). Clearance (CL)
–1
1/2
e
1/2
Given these simplifications, the volume of this theoretical compartment may be estimated using the equation CL = k × Vd = 0.3465 × 12.5 = 4.33 L/h = 72 mL/min.
e
section11.indd 1224 1/19/2015 10:52:05 AM