
Page 1757 - Hall et al (2015) Principles of Critical Care-McGraw-Hill
P. 1757
1226 PART 11: Special Problems in Critical Care
A 130 B of a substance (CL TOT ) usually represents the algebraic sum of several
120 100 clearance processes; in many cases, this may be represented as follows:
110 Terminal half-life = 2 hours of these component processes and the effects of the altered physiology
CL
= CL
+ CL
+ CL
TOT
other
renal
hepatic
Plasma concentration (Cp, g/mL) 80 Log Cp 10 of critical illness on their relative importance in achieving clearance of
100
For most drugs, it is appropriate to consider the magnitude of each
90
parent drug and metabolites. Clearance of any agent by an eliminating
70
organ is proportional to, but cannot exceed, blood flow to the eliminat-
60
ing organ: CL = Q × (C − C ), where Q is organ blood flow, and C
A
A
V
50
and C are the drug concentrations in the arterial and venous blood
V
40
parameters relevant to the individualization of critical care drug thera-
30
peutics will be discussed below.
20 supplies to the eliminating organ, respectively. These and other PK
10 ■ PHARMACODYNAMIC MODELING
0 1 It is a basic tenet of the above approach that pharmacologic response is
0 2 4 6 8 10 0 2 4 6 8 10 proportional to plasma drug concentration. Four additional determi-
Time (hours) nants of pharmacologic response merit emphasis in this regard: (1) the
“effect site” concept, (2) the importance of the free (unbound) plasma
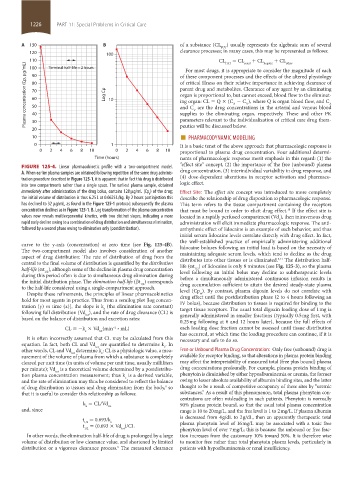
FIGURE 125-4. Linear pharmacokinetic profile with a two-compartment model.
A. When earlier plasma samples are obtained following repetition of the same drug adminis- drug concentration, (3) interindividual variability in drug response, and
tration procedure described in Figure 125-1, it is apparent that in fact this drug is distributed (4) dose-dependent alterations in receptor activation and pharmaco-
into two compartments rather than a single space. The earliest plasma sample, obtained logic effect.
immediately after administration of the drug bolus, contains 128 µg/mL (Cp ) of the drug; Effect Site: The effect site concept was introduced to more completely
0
the initial volume of distribution is thus 6.25 L or 0.0625 L/kg. By 2 hours postinjection this describe the relationship of drug disposition to pharmacologic response.
has declined to 32 µg/mL, as found in the Figure 125-1 protocol; subsequently the plasma This term refers to the tissue compartment containing the receptors
concentration declines as in Figure 125-1. B. Log transformation of the plasma concentration that must be bound in order to elicit drug effect. If the effect site is
10
values now reveals multiexponential kinetics, with two distinct slopes, indicating a more located in a rapidly perfused compartment (Vd ), then intravenous drug
c
rapid early decline owing to a combination of drug distribution and simultaneous elimination, administration will elicit immediate pharmacologic response. The anti-
followed by a second phase owing to elimination only (postdistribution). arrhythmic effect of lidocaine is an example of such behavior, and thus
initial serum lidocaine levels correlate directly with drug effect. In fact,
the well-established practice of empirically administering additional
curve to the y-axis (concentration) at zero time (see Fig. 125-4B). lidocaine boluses following an initial load is based on the necessity of
The two-compartment model also involves consideration of another maintaining adequate serum levels, which tend to decline as the drug
aspect of drug distribution: The rate of distribution of drug from the distributes into other tissues or is eliminated. The distribution half-
3,11
central to the final volume of distribution is quantified by the distribution life (αt ) of lidocaine is only 8 minutes (see Fig. 125-3), so the plasma
half-life (αt ), although some of the decline in plasma drug concentration level following an initial bolus may decline to subtherapeutic levels
1/2
1/2
during this period often is due to simultaneous drug elimination during before a simultaneously administered continuous infusion results in
the initial distribution phase. The elimination half-life (βt ) corresponds drug accumulation sufficient to attain the desired steady-state plasma
1/2
to the half-life considered using a single-compartment approach. level (Cp ). By contrast, plasma digoxin levels do not correlate with
Despite these refinements, the principles of linear pharmacokinetics ss
hold for most agents in practice. Thus from a semilog plot [log concen- drug effect until the postdistribution phase (2 to 4 hours following an
IV bolus), because distribution to tissues is required for binding to the
tration (y) vs time (x)], the slope is k (the elimination rate constant) target tissue receptors. The usual total digoxin loading dose of 1 mg is
e
following full distribution (Vd ), and the rate of drug clearance (CL) is generally administered in smaller fractions (typically 0.5 mg first, with
tot
based on the balance of distribution and excretion rates:
0.25 mg following at 6 and 12 hours later), because the full effects of
CL = −k × Vd (min · mL) each loading dose fraction cannot be assessed until tissue distribution
–1
e tot has occurred, at which time the loading procedure can continue, if it is
It is often incorrectly assumed that CL may be calculated from this necessary and safe to do so.
equation. In fact, both CL and Vd are quantified to determine k . In
tot
e
other words, CL and Vd determine k : CL is a physiologic value, a mea- Free or Unbound Plasma Drug Concentration: Only free (unbound) drug is
tot
e
surement of the volume of plasma from which a substance is completely available for receptor binding, so that alterations in plasma protein binding
cleared per unit time (in units of volume per unit time, usually milliliters may affect the interpretability of measured total (free plus bound) plasma
per minute); Vd is a theoretical volume determined by a postdistribu- drug concentrations profoundly. For example, plasma protein binding of
tot
tion plasma concentration measurement; thus k is a derived variable, phenytoin is diminished by either hypoalbuminemia or uremia, the former
e
and the rate of elimination may thus be considered to reflect the balance owing to lesser absolute availability of albumin binding sites, and the latter
of drug distribution to tissues and drug elimination from the body, so thought to be a result of competitive occupancy of these sites by “uremic
9
that it is useful to consider this relationship as follows: substances.” As a result of this phenomenon, total plasma phenytoin con-
centrations are often misleading in such patients. Phenytoin is normally
k = CL/Vd tot 90% plasma protein bound, so that the usual total plasma concentration
e
and, since range is 10 to 20 mg/L, and the free level is 1 to 2 mg/L. If plasma albumin
is decreased from 4 g/dL to 2 g/dL, then an apparently therapeutic total
t = 0.693/k e
1/2
t = (0.693 × Vd )/CL plasma phenytoin level of 16 mg/L may be associated with a toxic free
1/2 tot phenytoin level of over 7 mg/L; this is because the unbound or free frac-
In other words, the elimination half-life of drug is prolonged by a large tion increases from the customary 10% toward 50%. It is therefore wise
volume of distribution or low clearance value, and shortened by limited to monitor free rather than total phenytoin plasma levels, particularly in
distribution or a vigorous clearance process. The measured clearance patients with hypoalbuminemia or renal insufficiency.
6
section11.indd 1226 1/19/2015 10:52:07 AM