Page 141 - 9780077418427.pdf
P. 141

/Users/user-f465/Desktop
          tiL12214_ch05_115-138.indd Page 118  9/1/10  9:39 PM user-f465
          tiL12214_ch05_115-138.indd Page 118  9/1/10  9:39 PM user-f465                                                /Users/user-f465/Desktop


                     cycles per second, the relationship is
                                                                                             1 cycle
                                              1 _
                                          T =

                                              f
                                                                                                               Maximum
                                                           equation 5.1                                        displacement
                   or
                                                                                                               Rest
                                             1 _
                                          f =                                                                  position

                                             T                                                      Amplitude
                                                           equation 5.2                                        Maximum
                                                                                                               displacement


                   EXAMPLE 5.1                                                          Paper pulled this way
                   A vibrating system has a period of 0.5 s. What is the frequency in Hz?
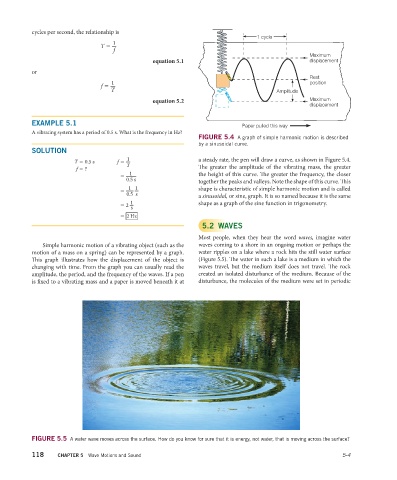
                                                                          FIGURE 5.4  A graph of simple harmonic motion is described
                                                                          by a sinusoidal curve.
                   SOLUTION
                                                  1 _
                                 T = 0.5 s     f =                        a steady rate, the pen will draw a curve, as shown in Figure 5.4.

                                                  T

                                 f = ?                                    The greater the amplitude of the vibrating mass, the greater
                                                   1 _                    the height of this curve. The greater the frequency, the closer

                                                =

                                                  0.5 s
                                                                          together the peaks and valleys. Note the shape of this curve. Th is
                                                   1 _ 1 _                shape is characteristic of simple harmonic motion and is called
                                                 =

                                                  0.5 s
                                                                          a sinusoidal, or sine, graph. It is so named because it is the same
                                                   1 _                    shape as a graph of the sine function in trigonometry.
                                                = 2

                                                   s
                                                = 2 Hz
                                                                           5.2 WAVES
                                                                          Most people, when they hear the word  waves, imagine water
                      Simple harmonic motion of a vibrating object (such as the   waves coming to a shore in an ongoing motion or perhaps the
                   motion of a mass on a spring) can be represented by a graph.   water ripples on a lake where a rock hits the still water surface

                   This graph illustrates how the displacement of the object is   (Figure 5.5). The water in such a lake is a medium in which the

                   changing with time. From the graph you can usually read the   waves travel, but the medium itself does not travel. Th e  rock
                   amplitude, the period, and the frequency of the waves. If a pen   created an isolated disturbance of the medium. Because of the

                   is fixed to a vibrating mass and a paper is moved beneath it at   disturbance, the molecules of the medium were set in periodic


                   FIGURE 5.5  A water wave moves across the surface. How do you know for sure that it is energy, not water, that is moving across the surface?

                   118     CHAPTER 5  Wave Motions and Sound                                                              5-4
   136   137   138   139   140   141   142   143   144   145   146