Page 17 - Focus SPM KSSM Tg 4.5 - Add Maths
P. 17

Additional Mathematics SPM  Chapter 2  Quadratic Functions


             For the case of a . 0:                   For the case of a  0:
             When the value of  b changes, the position of  When the value of  b changes, the position of
             vertex                                   vertex
             •  will be shifted to the left when b . 0.  •  will be shifted to the right when b . 0.
             •  will be shifted  to the right when b  0.  •  will be shifted to the left when b  0.
                                                SPM Tips

                   •  The larger the value of |b |, the further the position of vertex is displaced from the y-axis.
                   •  When b = 0, the vertex is on the y-axis.
                   •  When the same value of b changes sign from positive to negative or from negative to
                     positive, the position of the graph is reflected on the y-axis.

                      Moves     f(x)                                     f(x)
                      upwards                                  Moves upwards
 Form 4
                      when            c > 0                                  c > 0
                      c > 0                                    when
                                      c = 0                    c > 0              x
                                                                          0
                                         x                     Moves           c = 0
                       Moves    0                              downwards
    Only the           downwards    c < 0                      when            c < 0
                                                               c < 0
                       when
    value of c         c < 0
    changes  When the value of c changes, the shape of the graph is unchanged but the position of the graph
             •  will be shifted vertically upwards when c . 0.
             •  will be shifted vertically downwards when c  0.
                              SPM Tips                                        The effects of the
                                                                              changes in a, b
                                                                              and c on the graph
              c is the value of the y-intercept.                        INFO

                                                      The y-intercept does not change.
              14                                                               f(x)
                                                                f(x) = x  + 2x + 2
                                                                     2
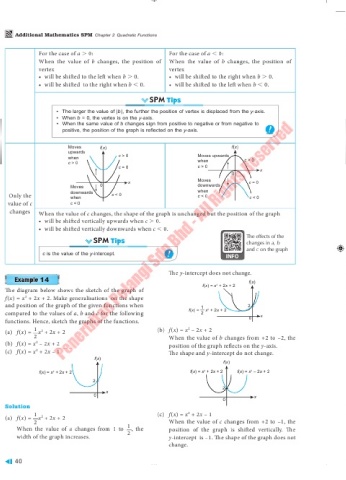
   The diagram below shows the sketch of the graph of
   f(x) = x  + 2x + 2. Make generalisations  on the shape
         2
   and position of the graph of the given functions when        1             2
                                                                —
                                                                  2
   compared to the values of a, b and c for the following   f(x) =     x  + 2x + 2  x
                                                                2
   functions. Hence, sketch the graphs of the functions.                       0
            1                                     (b)  f(x) = x  – 2x + 2
                                                            2
   (a)  f(x) =  x  + 2x + 2
              2
            2                                         When the value of b changes from +2 to –2, the
   (b)  f(x) = x  – 2x + 2                            position of the graph reflects on the y-axis.
            2
   (c)  f(x) = x  + 2x – 1                            The shape and y-intercept do not change.
            2
                               f(x)
                                                                       f(x)
                                                                 2
             f(x) = x  + 2x + 2                             f(x) = x  + 2x + 2  f(x) = x  – 2x + 2
                                                                               2
                  2
                              2
                                                                       2
                                  x
                              0                                                 x
                                                                       0
   Solution
            1
                                                            2
   (a)  f(x) =  x  + 2x + 2                       (c)  f(x) = x  + 2x – 1
              2
            2                            1            When the value of c changes from +2 to –1, the
      When the value of  a changes from 1 to  , the   position of the graph is shifted vertically. The
                                         2
      width of the graph increases.                   y-intercept  is –1. The shape of the graph does not
                                                      change.
      40
   12   13   14   15   16   17   18   19   20   21   22