
Page 23 - Focus SPM KSSM Tg 4.5 - Add Maths
P. 23
Additional Mathematics SPM Chapter 2 Quadratic Functions
24 f(x)
2
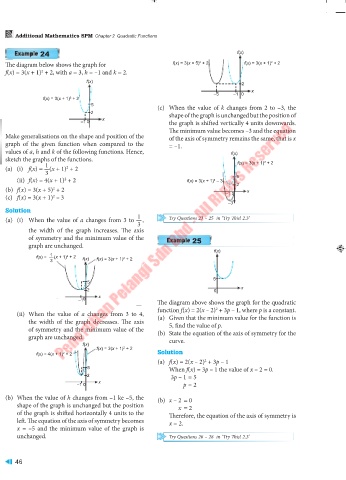
The diagram below shows the graph for f(x) = 3(x + 5) + 2 f(x) = 3(x + 1) + 2
2
f(x) = 3(x + 1) + 2, with a = 3, h = –1 and k = 2.
2
f(x)
2
x
–5 –1 0
2
f(x) = 3(x + 1) + 2
5 (c) When the value of k changes from 2 to –3, the
2 shape of the graph is unchanged but the position of
x
–1 0 the graph is shifted vertically 4 units downwards.
The minimum value becomes –3 and the equation
Make generalisations on the shape and position of the of the axis of symmetry remains the same, that is x
graph of the given function when compared to the = –1.
values of a, h and k of the following functions. Hence, f(x)
Form 4
sketch the graphs of the functions. f(x) = 3(x + 1) + 2
2
1
(a) (i) f(x) = (x + 1) + 2
2
3
(ii) f(x) = 4(x + 1) + 2 f(x) = 3(x + 1) – 3 5
2
2
2
(b) f(x) = 3(x + 5) + 2 x
2
(c) f(x) = 3(x + 1) – 3 –1 0
2
–3
Solution
1
(a) (i) When the value of a changes from 3 to , Try Questions 23 – 25 in ‘Try This! 2.3’
3
the width of the graph increases. The axis
of symmetry and the minimum value of the 25
graph are unchanged.
f(x)
1
f(x) = (x + 1) + 2 f(x) f(x) = 3(x + 1) + 2
2
—
2
3
5
5
2 0 x
x
–1 0 The diagram above shows the graph for the quadratic
2
function f(x) = 2(x – 2) + 3p – 1, where p is a constant.
(ii) When the value of a changes from 3 to 4, (a) Given that the minimum value for the function is
the width of the graph decreases. The axis 5, find the value of p.
of symmetry and the minimum value of the (b) State the equation of the axis of symmetry for the
graph are unchanged. curve.
f(x)
f(x) = 3(x + 1) + 2
2
f(x) = 4(x + 1) + 2 Solution
2
(a) f(x) = 2(x – 2) + 3p – 1
2
5 When f(x) = 3p – 1 the value of x – 2 = 0.
2 3p – 1 = 5
x
–1 0 p = 2
(b) When the value of h changes from –1 ke –5, the (b) x – 2 = 0
shape of the graph is unchanged but the position x = 2
of the graph is shifted horizontally 4 units to the Therefore, the equation of the axis of symmetry is
left. The equation of the axis of symmetry becomes x = 2.
x = –5 and the minimum value of the graph is
unchanged. Try Questions 26 – 28 in ‘Try This! 2.3’
46