
Page 28 - Focus SPM KSSM Tg 4.5 - Add Maths
P. 28
Additional Mathematics SPM Chapter 2 Quadratic Functions
25. Compare the graph of the quadratic function 31. The curve of the quadratic function f(x) = (x – h) + k
2
1
f(x) = (x – 2) – 3 to the graph of the function intersects the x-axis at points (–2, 0) and (3, 0). The
2
1
2 line y = –6 touches the curve at its minimum point.
f(x) = x . Sketch and comment on the differences 4
2
between these two graphs. (a) Find the values of h and k.
(b) Sketch the graph of f(x) for –3 < x < 4.
26. (c) If the graph is reflected at the x-axis, write the
f(x) equation of the curve.
32. The weekly profit, K(x), in RM, for a company that
sells calculators is given by the quadratic function,
x K(x) = –0.5x + 40x – 200, where x is the number of
2
0
k calculators sold every week.
(a) Express K(x) in the vertex form.
The diagram above shows the graph of the quadratic (b) Find
function f(x) = x – 7 2 2 – 2, where k is the vertex of (i) the number of calculators that must be Form 4
sold per week to obtain maximum profit,
the graph. State (ii) the maximum profit. HOTS
(a) the value of k, Applying
(b) the equation of the axis of symmetry of the 33. The daily cost, H, in RM, for a factory that produces
curve. decorative lamps is given by the quadratic function,
1
2
27. H(x) = 500 – 8x + x , where x is the number of
4
f(x)
units of decorative lamps produced per day.
x (a) Express H(x) in the vertex form.
(p, –6) 0 (b) Find
(i) the number of decorative lamps that must
be produced per day to achieve minimum
cost,
The diagram above shows the graph of the quadratic (ii) the minimum cost. HOTS
function f(x) = –(x + 4) + 3q, where q is a constant. Applying
2
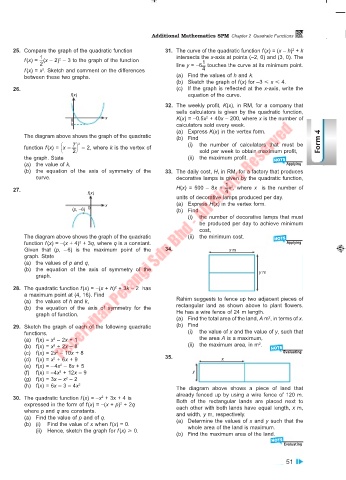
Given that (p, – 6) is the maximum point of the 34. x m
graph. State
(a) the values of p and q,
(b) the equation of the axis of symmetry of the
graph. y m
28. The quadratic function f(x) = –(x + h) + 3k – 2 has
2
a maximum point at (4, 16). Find
(a) the values of h and k, Rahim suggests to fence up two adjacent pieces of
(b) the equation of the axis of symmetry for the rectangular land as shown above to plant flowers.
graph of function. He has a wire fence of 24 m length.
(a) Find the total area of the land, A m , in terms of x.
2
29. Sketch the graph of each of the following quadratic (b) Find
functions. (i) the value of x and the value of y, such that
(a) f(x) = x – 2x + 1 the area A is a maximum,
2
2
(b) f(x) = x + 2x – 8 (ii) the maximum area, in m . HOTS
2
(c) f(x) = 2x – 10x + 8 Evaluating
2
(d) f(x) = x + 6x + 9 35. x
2
(e) f(x) = – 4x – 8x + 5
2
(f) f(x) = –4x + 12x – 9 y
2
(g) f(x) = 3x – x – 2
2
(h) f(x) = 6x – 3 – 4x 2 The diagram above shows a piece of land that
already fenced up by using a wire fence of 120 m.
30. The quadratic function f(x) = –x + 3x + 4 is Both of the rectangular lands are placed next to
2
expressed in the form of f(x) = –(x + p) + 2q each other with both lands have equal length, x m,
2
where p and q are constants. and width, y m, respectively.
(a) Find the value of p and of q. (a) Determine the values of x and y such that the
(b) (i) Find the value of x when f(x) = 0.
(ii) Hence, sketch the graph for f(x) > 0. whole area of the land is maximum.
(b) Find the maximum area of the land.
HOTS
Evaluating
51