
Page 43 - mutual-fund-insight - Mar 2021_Neat
P. 43
FUND MIRAE ASSET TAX SAVER FUND REGULAR DIRECT
ANALYST’S
CH ICE A champ in making
Launch he fund has remained in the state of the markets. The portfolio is
December 2015 top quartile in four of the five usually well spread out across 55-60
Fund manager Tcalendar years it has stocks. But the fund avoids companies
Neelesh Surana
completed thus far. In one year, it which lack a threshold scale, say of
missed the top quartile by a whisker. about `100 crore in operating profits.
The fund follows a ‘growth at a It also avoids taking cash calls and
Expense ratio (%) reasonable price’ strategy to pick usually remains fully invested.
DIRECT stocks. It prefers buying quality The fund has the makings of one
0.25 1.15
MIN FUND MEDIAN MAX stocks of businesses backed by of the most sought-after funds in its
strong cash flows, competitive category. It doesn’t yet have as long a
0.25 2.04 advantages and a decent return on track record as some of its peers, but
REGULAR capital employed. The fund is with Neelesh Surana at the helm, we
1.86 2.28
MIN FUND MEDIAN MAX disciplined about avoiding think it has what it takes to continue
overvalued growth stocks. building upon its strong start.
1.62 2.58
You can expect the portfolio to Its unbelievably low expense ratio
Trailing returns (%) always have a bias for large-cap of just 0.25 per cent for the direct
Regular Direct S&P BSE 500 TRI stocks, with 60–70 per cent of the plan adds further to its appeal. A lot
money usually invested in them. of its peers may find it almost
20.56 However, the fund exercises its impossible to match it on this front.
1-Year 22.40 discretion to increase its allocation Go for it for its disciplined and
16.46
beyond that, as it did in the financial diversified approach to growth
10.04 year 2018-19, depending upon the investing.
3-Year 11.67
6.76
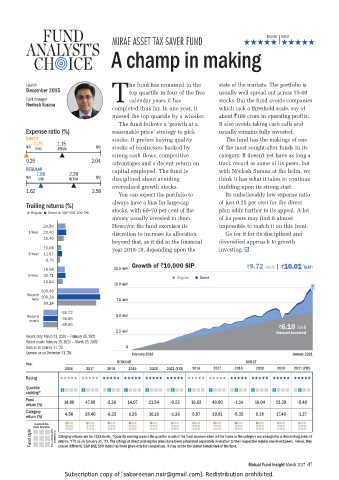
Growth of `10,000 SIP `9.72 lakh | `10.01 lakh
18.98 12.5 lakh
5-Year 20.71 Regular Direct
13.83
10.0 lakh
106.48
Recent 109.28
rally 7.5 lakh
99.14
-35.72
Recent -35.66 5.0 lakh
crash
-35.60 `6.10 lakh
2.5 lakh Amount invested
Recent rally: March 23, 2020 — February 05, 2021
Recent crash: February 25, 2020 — March 23, 2020
Data as on January 31, ‘21. 0
Expense as on December 31, ‘20. February 2016 January 2021
REGULAR DIRECT
Year
2016 2017 2018 2019 2020 2021 (YTD) 2016 2017 2018 2019 2020 2021 (YTD)
Rating
Quartile 1 2 3 4 1 2 3 4 1 2 3 4 1 2 3 4 1 2 3 4 1 2 3 4 1 2 3 4 1 2 3 4 1 2 3 4 1 2 3 4 1 2 3 4 1 2 3 4
ranking*
Fund 14.80 47.88 -2.26 14.07 21.54 -0.53 16.63 49.80 -1.14 16.04 23.39 -0.40
return (%)
Category 4.58 38.40 -6.33 8.26 16.16 -1.36 5.57 39.81 -5.35 9.38 17.46 -1.27
return (%)
Investment style
Fund style Growth Blend Value Large Medium Small Capitalisation Category returns are for ELSS funds. *Quartile ranking means the quartile in which the fund appears when all the funds in the category are arranged in a descending order of
returns. YTD as on January 31, ’21. The ratings of direct and regular plans have been calculated separately in relation to their respective regular and direct peers. Hence, they
can be different. S&P BSE 500 index has been given only for comparison. It may not be the stated benchmark of the fund.
Mutual Fund Insight March 2021 41
Subscription copy of [sabareesan.nair@gmail.com]. Redistribution prohibited.