
Page 41 - mutual-fund-insight - Mar 2021_Neat
P. 41
FUND DSP TAX SAVER FUND REGULAR DIRECT
ANALYST’S
CH ICE A flexible approach
Launch he fund has done a pretty strong and provide long-term
January 2007 good job of beating an average compounding opportunities. But that
Fund manager Tpeer over the years. Its 10-year doesn’t mean that it goes overboard
Rohit Singhania
Charanjit Singh returns place it among the top five on expensive stocks. Unlike many of
funds in the category. It hit a bit of a its peers, the P/E ratio of its portfolio
rough patch in 2017 and 2018 when has hardly crossed 25 in the last five
Expense ratio (%) it found a place in the third quartile years.
DIRECT of the category. But it staged a great The fund maintains a well-
0.87 1.15
MIN FUND MEDIAN MAX comeback in 2019 to be ranked diversified portfolio of over 60 stocks
among the top three. and the allocation to large caps has
0.25 2.04 The fund doesn’t have a strong usually remained in a narrow range
REGULAR bias for either the growth or value of around 70 per cent in the last five
1.85 2.28
MIN FUND MEDIAN MAX styles of investing. Stocks are picked years. So, the portfolio is managed in
for the sustainability of their earnings a fairly conservative manner.
1.62 2.58
growth and return on equity. The Despite that, its track record
Trailing returns (%) fund is also open to taking positions suggests that the fund tends to fall
Regular Direct S&P BSE 500 TRI in stocks which present mispricing slightly more than the category
opportunities due to corporate average during bear phases but also
14.20 actions or relative to the company’s rises more than the category during a
1-Year 15.28 cash-generation ability. bull phase. But in any five-year
16.46
The valuations may take a back period in its life, it has remained
6.98 seat at times if business drivers are ahead of an average peer.
3-Year 8.02
6.76
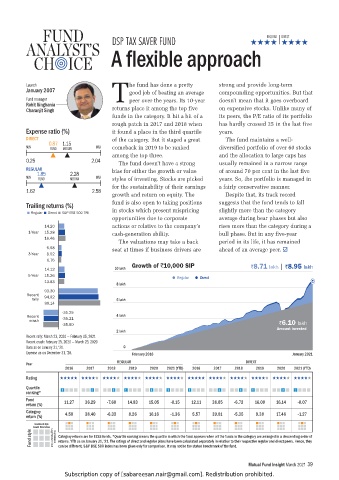
Growth of `10,000 SIP `8.71 lakh | `8.95 lakh
14.12 10 lakh
5-Year 15.26 Regular Direct
13.83
8 lakh
93.30
Recent 94.92
rally 6 lakh
99.14
-35.25
Recent -35.21 4 lakh
crash `6.10 lakh
-35.60
2 lakh Amount invested
Recent rally: March 23, 2020 — February 05, 2021
Recent crash: February 25, 2020 — March 23, 2020
Data as on January 31, ‘21. 0
Expense as on December 31, ‘20. February 2016 January 2021
REGULAR DIRECT
Year
2016 2017 2018 2019 2020 2021 (YTD) 2016 2017 2018 2019 2020 2021 (YTD)
Rating
Quartile 1 2 3 4 1 2 3 4 1 2 3 4 1 2 3 4 1 2 3 4 1 2 3 4 1 2 3 4 1 2 3 4 1 2 3 4 1 2 3 4 1 2 3 4 1 2 3 4
ranking*
Fund 11.27 36.29 -7.60 14.83 15.05 -0.15 12.11 38.05 -6.72 16.00 16.14 -0.07
return (%)
Category 4.58 38.40 -6.33 8.26 16.16 -1.36 5.57 39.81 -5.35 9.38 17.46 -1.27
return (%)
Investment style
Fund style Growth Blend Value Large Medium Small Capitalisation Category returns are for ELSS funds. *Quartile ranking means the quartile in which the fund appears when all the funds in the category are arranged in a descending order of
returns. YTD as on January 31, ’21. The ratings of direct and regular plans have been calculated separately in relation to their respective regular and direct peers. Hence, they
can be different. S&P BSE 500 index has been given only for comparison. It may not be the stated benchmark of the fund.
Mutual Fund Insight March 2021 39
Subscription copy of [sabareesan.nair@gmail.com]. Redistribution prohibited.