
Page 1212 - How to Make Money in Stocks Trilogy
P. 1212
Don’t Invest Blindly: Use Charts to See the Best Time to Buy and Sell 195
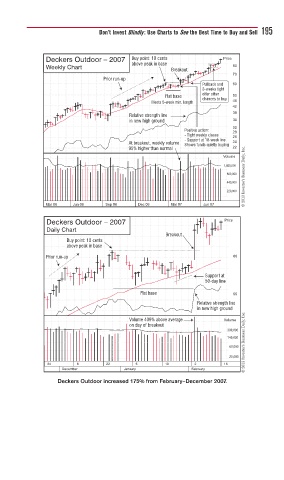
Deckers Outdoor – 2007 Buy point: 10 cents Price
above peak in base
Weekly Chart 80
Breakout
70
Prior run-up
Pullback and 60
3-weeks tight
offer other
Flat base 50
chances to buy
Meets 5-week min. length 46
42
38
Relative strength line
in new high ground 34
30
Positive action: 28
- Tight weekly closes 26
- Support at 10-week line
At breakout, weekly volume Shows funds quietly buying 24
© 2013 Investor’s Business Daily, Inc.
95% higher than normal 22
Volume
1,660,000
860,000
440,000
220,000
Mar 06 Jun 06 Sep 06 Dec 06 Mar 07 Jun 07
Deckers Outdoor – 2007 Price
Daily Chart
Breakout
Buy point: 10 cents
above peak in base
Prior run-up 60
Support at
50-day line
Flat base 55
Relative strength line
in new high ground
© 2013 Investor’s Business Daily, Inc.
Volume 409% above average Volume
on day of breakout
300,000
140,000
60,000
20,000
24 8 22 5 19 2 16
December January February
Deckers Outdoor increased 175% from February–December 2007.