
Page 265 - SK Year 5 Mathematics DLP
P. 265
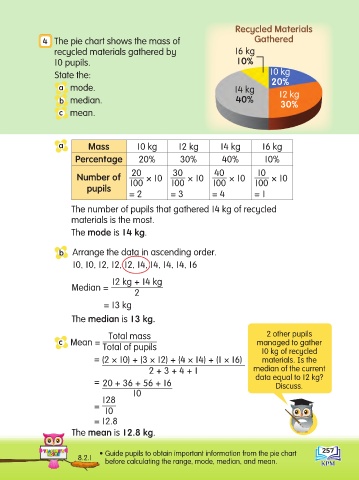
Recycled Materials
                   4   The pie chart shows the mass of                            Gathered
                      recycled materials gathered by                        16 kg
                      10 pupils.                                             10%
                      State the:                                                       10 kg
                                                                                       20%
                       a  mode.                                             14 kg
                        b  median.                                           40%          12 kg
                                                                                          30%
                        c  mean.


                       a        Mass           10 kg       12 kg        14 kg        16 kg
                            Percentage         20%          30%          40%         10%

                                             20           30          40           10
                             Number of            × 10        × 10         × 10         × 10
                                pupils       100         100          100         100
                                             = 2         = 3         = 4          = 1
                            The number of pupils that gathered 14 kg of recycled
                           materials is the most.

                           The mode is 14 kg.


                        b   Arrange the data in ascending order.
                            10, 10, 12, 12, 12, 14, 14, 14, 14, 16

                                       12 kg + 14 kg
                           Median =
                                              2
                                     = 13 kg

                           The median is 13 kg.

                                      Total mass                                      2 other pupils
                       c  Mean =                                                   managed to gather
                                     Total of pupils
                                                                                    10 kg of recycled
                                   = (2 × 10) + (3 × 12) + (4 × 14) + (1 × 16)       materials. Is the
                                                   2 + 3 + 4 + 1                  median of the current
                                   =  20 + 36 + 56 + 16                            data equal to 12 kg?
                                                                                         Discuss.
                                              10
                                     128
                                   =
                                     10
                                   = 12.8
                           The mean is 12.8 kg.

                                                                                                       257
                                    • Guide pupils to obtain important information from the pie chart
                             8.2.1
                                     before calculating the range, mode, median, and mean.