Page 200 - MARSIUM'21 COMP OF PAPER
P. 200

178                                        Fatin Nazurah (2022)


            ■  4.0 DATA ANALYSIS

            4.1 Profile of Respondents

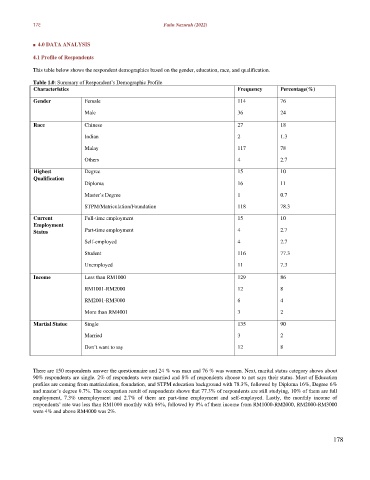
            This table below shows the respondent demographics based on the gender, education, race, and qualification.

            Table 1.0: Summary of Respondent’s Demographic Profile
            Characteristics                                                     Frequency     Percentage(%)
            Gender           Female                                             114           76

                             Male                                               36            24
            Race             Chinese                                            27            18

                             Indian                                             2             1.3

                             Malay                                              117           78

                             Others                                             4             2.7
            Highest          Degree                                             15            10
            Qualification
                             Diploma                                            16            11

                             Master’s Degree                                    1             0.7

                             STPM/Matriculation/Foundation                      118           78.3
            Current          Full-time employment                               15            10
            Employment
            Status           Part-time employment                               4             2.7
                             Self-employed                                      4             2.7

                             Student                                            116           77.3

                             Unemployed                                         11            7.3
            Income           Less than RM1000                                   129           86

                             RM1001-RM2000                                      12            8

                             RM2001-RM3000                                      6             4

                             More than RM4001                                   3             2
            Martial Statue   Single                                             135           90

                             Married                                            3             2

                             Don’t want to say                                  12            8


            There are 150 respondents answer the questionnaire and 24 % was man and 76 % was women. Next, marital status category shows about
            90% respondents are single. 2% of respondents were married and 8% of respondents choose to not says their status. Most of Education
            profiles are coming from matriculation, foundation, and STPM education background with 78.3%, followed by Diploma 16%, Degree 6%
            and master’s degree 0.7%. The occupation result of respondents shows that 77.3% of respondents are still studying, 10% of them are full
            employment,  7.3%  unemployment  and  2.7%  of  them  are  part-time  employment  and  self-employed.  Lastly,  the  monthly  income  of
            respondents’ rate was less than RM1000 monthly with 86%, followed by 8% of them income from RM1000-RM2000, RM2000-RM3000
            were 4% and above RM4000 was 2%.


                                                                                                               178
   195   196   197   198   199   200   201   202   203   204   205