
Page 201 - MARSIUM'21 COMP OF PAPER
P. 201
179 Fatin Nazurah (2022)
4.2 Descriptive data
The table below shows the descriptive data of the effect of using animation characters in brand elements, brand advertising and brand
awareness.
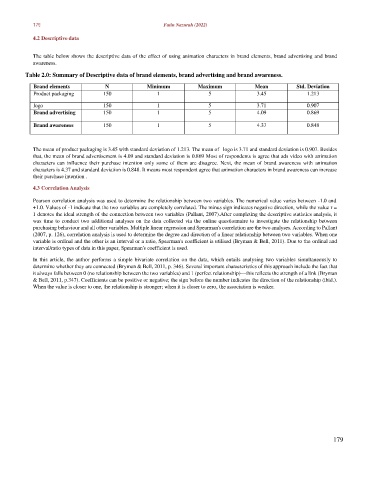
Table 2.0: Summary of Descriptive data of brand elements, brand advertising and brand awareness.
Brand elements N Minimum Maximum Mean Std. Deviation
Product packaging 150 1 5 3.45 1.213
logo 150 1 5 3.71 0.907
Brand advertising 150 1 5 4.09 0.869
Brand awareness 150 1 5 4.37 0.848
The mean of product packaging is 3.45 with standard deviation of 1.213. The mean of logo is 3.71 and standard deviation is 0.907. Besides
that, the mean of brand advertisement is 4.09 and standard deviation is 0.869 Most of respondents is agree that ads video with animation
characters can influence their purchase intention only some of them are disagree. Next, the mean of brand awareness with animation
characters is 4.37 and standard deviation is 0.848. It means most respondent agree that animation characters in brand awareness can increase
their purchase intention .
4.3 Correlation Analysis
Pearson correlation analysis was used to determine the relationship between two variables. The numerical value varies between -1.0 and
+1.0. Values of -1 indicate that the two variables are completely correlated. The minus sign indicates negative direction, while the value r =
1 denotes the ideal strength of the connection between two variables (Pallant, 2007).After completing the descriptive statistics analysis, it
was time to conduct two additional analyses on the data collected via the online questionnaire to investigate the relationship between
purchasing behaviour and all other variables. Multiple linear regression and Spearman's correlation are the two analyses. According to Pallant
(2007, p. 126), correlation analysis is used to determine the degree and direction of a linear relationship between two variables. When one
variable is ordinal and the other is an interval or a ratio, Spearman's coefficient is utilised (Bryman & Bell, 2011). Due to the ordinal and
interval/ratio types of data in this paper, Spearman's coefficient is used.
In this article, the author performs a simple bivariate correlation on the data, which entails analysing two variables simultaneously to
determine whether they are connected (Bryman & Bell, 2011, p. 346). Several important characteristics of this approach include the fact that
it always falls between 0 (no relationship between the two variables) and 1 (perfect relationship)—this reflects the strength of a link (Bryman
& Bell, 2011, p.347). Coefficients can be positive or negative; the sign before the number indicates the direction of the relationship (ibid.).
When the value is closer to one, the relationship is stronger; when it is closer to zero, the association is weaker.
179