
Page 203 - MARSIUM'21 COMP OF PAPER
P. 203
181 Fatin Nazurah (2022)
brand advertising shows moderate positive relationship [r(150) = 0.449, p = 0.000]. Brand Awareness and purchase intention shows low
positive relationship [r(150)=0.235,p=0.004].
In conclusion, the youngster purchase intention increases when brand apply animation characters on brand elements, brand advertising and
brand awareness. Therefore, we fail to reject the null hypothesis. From the result, we accept all the hypothesis that apply animation characters
in brand elements, brand advertising and brand awareness have relationship with youngster purchase intention.
4.4 Multiple Regression Analysis
Regression analysis is a statistical technique that describes the connection between a response variable and its predictors mathematically or
functionally. The fundamental components of regression analysis include modelling, estimation, inference, and prediction. It is also useful
for estimating the value of the response variable and assessing the influence of analysts on it. The goal of this research is to look at the impact
of utilising animation characters in brand elements, brand advertising, and brand awareness on the purchase intentions of youngsters. As a
result, one response variable and three predictor variables were subjected to multiple regression analysis. Advertisement influence is regarded
as a response variable, and four variables are regarded as predictors. The following table summarises the findings of the regression analysis:
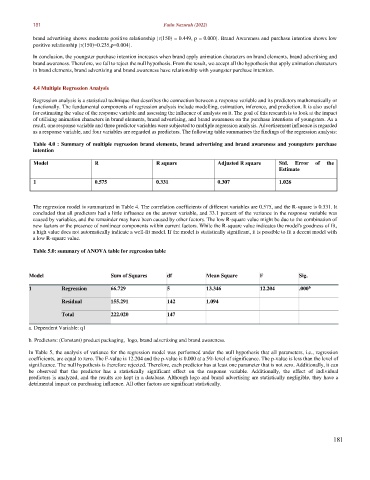
Table 4.0 : Summary of multiple regression brand elements, brand advertising and brand awareness and youngsters purchase
intention
Model R R square Adjusted R square Std. Error of the
Estimate
1 0.575 0.331 0.307 1.026
The regression model is summarized in Table 4. The correlation coefficients of different variables are 0.575, and the R-square is 0.331. It
concluded that all predictors had a little influence on the answer variable, and 33.1 percent of the variance in the response variable was
caused by variables, and the remainder may have been caused by other factors. The low R-square value might be due to the combination of
new factors or the presence of nonlinear components within current factors. While the R-square value indicates the model's goodness of fit,
a high value does not automatically indicate a well-fit model. If the model is statistically significant, it is possible to fit a decent model with
a low R-square value.
Table 5.0: summary of ANOVA table for regression table
Model Sum of Squares df Mean Square F Sig.
1 Regression 66.729 5 13.346 12.204 .000
b
Residual 155.291 142 1.094
Total 222.020 147
a. Dependent Variable: q1
b. Predictors: (Constant) product packaging, logo, brand advertising and brand awareness.
In Table 5, the analysis of variance for the regression model was performed under the null hypothesis that all parameters, i.e., regression
coefficients, are equal to zero. The F-value is 12.204 and the p-value is 0.000 at a 5% level of significance. The p-value is less than the level of
significance. The null hypothesis is therefore rejected. Therefore, each predictor has at least one parameter that is not zero. Additionally, it can
be observed that the predictor has a statistically significant effect on the response variable. Additionally, the effect of individual
predictors is analyzed, and the results are kept in a database. Although logo and brand advertising are statistically negligible, they have a
detrimental impact on purchasing influence. All other factors are significant statistically.
181