
Page 202 - MARSIUM'21 COMP OF PAPER
P. 202
180 Fatin Nazurah (2022)
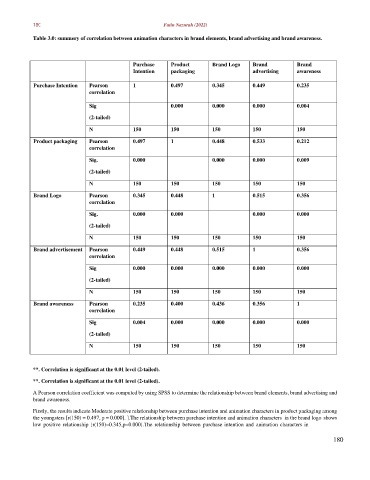
Table 3.0: summery of correlation between animation characters in brand elements, brand advertising and brand awareness.
Purchase Product Brand Logo Brand Brand
Intention packaging advertising awareness
Purchase Intention Pearson 1 0.497 0.345 0.449 0.235
correlation
Sig 0.000 0.000 0.000 0.004
(2-tailed)
N 150 150 150 150 150
Product packaging Pearson 0.497 1 0.448 0.533 0.212
correlation
Sig. 0.000 0.000 0.000 0.009
(2-tailed)
N 150 150 150 150 150
Brand Logo Pearson 0.345 0.448 1 0.515 0.356
correlation
Sig. 0.000 0.000 0.000 0.000
(2-tailed)
N 150 150 150 150 150
Brand advertisement Pearson 0.449 0.448 0.515 1 0.356
correlation
Sig 0.000 0.000 0.000 0.000 0.000
(2-tailed)
N 150 150 150 150 150
Brand awareness Pearson 0.235 0.400 0.436 0.356 1
correlation
Sig 0.004 0.000 0.000 0.000 0.000
(2-tailed)
N 150 150 150 150 150
**. Correlation is significant at the 0.01 level (2-tailed).
**. Correlation is significant at the 0.01 level (2-tailed).
A Pearson correlation coefficient was computed by using SPSS to determine the relationship between brand elements, brand advertising and
brand awareness.
Firstly, the results indicate Moderate positive relationship between purchase intention and animation characters in product packaging among
the youngsters [r(150) = 0.497, p = 0.000]. ].The relationship between purchase intention and animation characters in the brand logo shows
low positive relationship [r(150)=0.345,p=0.000].The relationship between purchase intention and animation characters in
180