
Page 281 - MARSIUM'21 COMP OF PAPER
P. 281
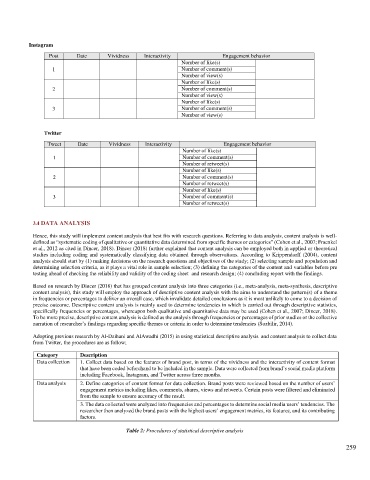
Instagram

                 Post     Date       Vividness   Interactivity             Engagement behavior
                                                             Number of like(s)
                  1                                          Number of comment(s)
                                                             Number of view(s)
                                                             Number of like(s)
                  2                                          Number of comment(s)
                                                             Number of view(s)
                                                             Number of like(s)
                  3                                          Number of comment(s)
                                                             Number of view(s)

                Twitter

                 Tweet     Date      Vividness   Interactivity             Engagement behavior
                                                             Number of like(s)
                   1                                         Number of comment(s)
                                                             Number of retweet(s)
                                                             Number of like(s)
                   2                                         Number of comment(s)
                                                             Number of retweet(s)
                                                             Number of like(s)
                   3                                         Number of comment(s)
                                                             Number of retweet(s)


            3.4 DATA ANALYSIS

            Hence, this study will implement content analysis that best fits with research questions. Referring to data analysis, content analysis is well-
            defined as “systematic coding of qualitative or quantitative data determined from specific themes or categories” (Cohen et al., 2007; Fraenkel
            et al., 2012 as cited in Dincer, 2018). Dincer (2018) further explained that content analysis can be employed both in applied or theoretical
            studies including coding and systematically classifying data obtained through observations. According to Krippendorff (2004),  content
            analysis should start by (1) making decisions on the research questions and objectives of the study; (2) selecting sample and population and
            determining selection criteria, as it plays a vital role in sample selection; (3) defining the categories of the content and variables before pre
            testing ahead of checking the reliability and validity of the coding sheet  and research design; (4) concluding report with the findings.

            Based on research by Dincer (2018) that has grouped content analysis into three categories (i.e., meta-analysis, meta-synthesis, descriptive
            content analysis), this study will employ the approach of descriptive content analysis with the aims to understand the pattern(s) of a theme
            in frequencies or percentages to deliver an overall case, which invalidate detailed conclusions as it is most unlikely to come to a decision of
            precise outcome. Descriptive content analysis is mainly used to determine tendencies in which is carried out through descriptive statistics,
            specifically frequencies or percentages, whereupon both qualitative and quantitative data may be used (Cohen et al., 2007; Dincer, 2018).
            To be more precise, descriptive content analysis is defined as the analysis through frequencies or percentages of prior studies or the collective
            narration of researcher’s findings regarding specific themes or criteria in order to determine tendencies (Sozbilir, 2014).

            Adopting previous research by Al-Daihani and AlAwadhi (2015) in using statistical descriptive analysis  and content analysis to collect data
            from Twitter, the procedures are as follow;

             Category       Description
             Data collection   1. Collect data based on the features of brand post, in terms of the vividness and the interactivity of content format
                            that have been coded beforehand to be included in the sample. Data were collected from brand’s social media platform
                            including Facebook, Instagram, and Twitter across three months.
             Data analysis   2. Define categories of content format for data collection. Brand posts were reviewed based on the number of users’
                            engagement metrics including likes, comments, shares, views and retweets. Certain posts were filtered and eliminated
                            from the sample to ensure accuracy of the result.
                            3. The data collected were analyzed into frequencies and percentages to determine social media users’ tendencies. The
                            researcher then analyzed the brand posts with the highest users’ engagement metrics, its features, and its contributing
                            factors.

                                           Table 2: Procedures of statistical descriptive analysis


                                                                                                                    259