
Page 283 - MARSIUM'21 COMP OF PAPER
P. 283
with videos instead of ‘3’; posts with the event to verify the accuracy and no discrepancies were identified. Hence, this explains why
posts that were coded as medium vividness only made up 3.26% (n=33) from the final sample.
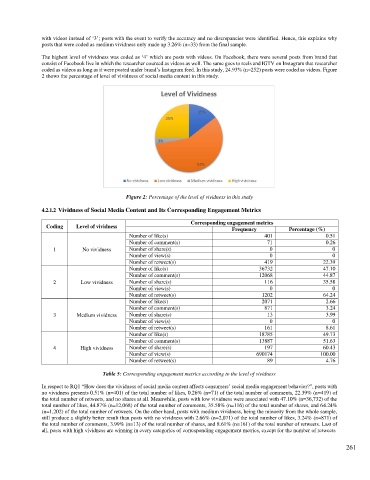
The highest level of vividness was coded as ‘4’ which are posts with videos. On Facebook, there were several posts from brand that
consist of Facebook live in which the researcher counted as videos as well. The same goes to reels and IGTV on Instagram that researcher
coded as videos as long as it were posted under brand’s Instagram feed. In this study, 24.93% (n=252) posts were coded as videos. Figure
2 shows the percentage of level of vividness of social media content in this study.
Figure 2: Percentage of the level of vividness in this study
4.2.1.2 Vividness of Social Media Content and Its Corresponding Engagement Metrics
Corresponding engagement metrics
Coding Level of vividness Frequency Percentage (%)
Number of like(s) 401 0.51
Number of comment(s) 71 0.26
1 No vividness Number of share(s) 0 0
Number of view(s) 0 0
Number of retweet(s) 419 22.39
Number of like(s) 36732 47.10
Number of comment(s) 12068 44.87
2 Low vividness Number of share(s) 116 35.58
Number of view(s) 0 0
Number of retweet(s) 1202 64.24
Number of like(s) 2071 2.66
Number of comment(s) 871 3.24
3 Medium vividness Number of share(s) 13 3.99
Number of view(s) 0 0
Number of retweet(s) 161 8.61
Number of like(s) 18785 49.73
Number of comment(s) 13887 51.63
4 High vividness Number of share(s) 197 60.43
Number of view(s) 690174 100.00
Number of retweet(s) 89 4.76
Table 5: Corresponding engagement metrics according to the level of vividness
In respect to RQ1 “How does the vividness of social media content affects consumers’ social media engagement behavior?”, posts with
no vividness presents 0.51% (n=401) of the total number of likes, 0.26% (n=71) of the total number of comments, 22.39% (n=419) of
the total number of retweets, and no shares at all. Meanwhile, posts with low vividness were associated with 47.10% (n=36,732) of the
total number of likes, 44.87% (n=12,068) of the total number of comments, 35.58% (n=116) of the total number of shares, and 64.24%
(n=1,202) of the total number of retweets. On the other hand, posts with medium vividness, being the minority from the whole sample,
still produce a slightly better result than posts with no vividness with 2.66% (n=2,071) of the total number of likes, 3.24% (n=871) of
the total number of comments, 3.99% (n=13) of the total number of shares, and 8.61% (n=161) of the total number of retweets. Last of
all, posts with high vividness are winning in every categories of corresponding engagement metrics, except for the number of retweets
261