
Page 282 - MARSIUM'21 COMP OF PAPER
P. 282
■4.0 FINDING
■4.0 FINDING
4.1 DATA SCREENING
This study presents an exploratory analysis of content format made by local skincare brands on Facebook, Instagram and Twitter. A total
of 1,154 posts across three social media platforms from two skincare brands within three months were examined. The research methodologies
adopted in this study are content analysis and statistical descriptive analysis.
To ensure accuracy of the result of this study, data screening is needed. After identifying the unrelated and irrelevant data to be excluded in
st
the final sample, a total of 1,011 posts were gathered from 1 of October 2021 until 31 of December 2021. As mentioned previously,
st
there were two types of posts; post(s) unrelated to skincare products and post(s) unrelated to the brand’s marketing purposes to be discounted
from the final sample. Table 3 below shows a total of 144 posts were excluded from the final sample as they were failed to meet the criteria
of the study within the three months period of data collection.
Social media Amount of post(s) excluded
platform Reason(s) Nature’s Palette Bougas Beauty
Facebook Makeup products, re-opening announcement, evening
event, top performer name list 0 132
Instagram Re-opening announcement, evening event, top achiever 0 6
name list
Twitter No interactivity in its features of content 6 0
Total 144
Table 3: Reason(s) and number of posts excluded
4.2 CONTENT ANALYSIS RESULTS
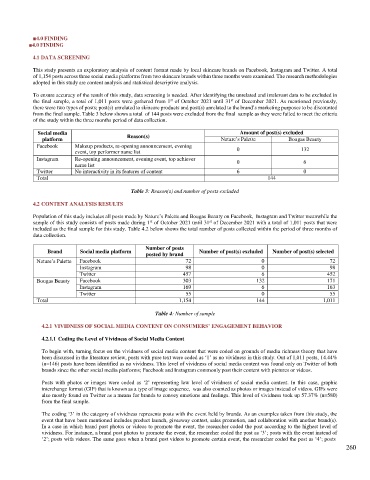
Population of this study includes all posts made by Nature’s Palette and Bougas Beauty on Facebook, Instagram and Twitter meanwhile the
st
sample of this study consists of posts made during 1 of October 2021 until 31 of December 2021 with a total of 1,011 posts that were
st
included as the final sample for this study. Table 4.2 below shows the total number of posts collected within the period of three months of
data collection.
Number of posts
Brand Social media platform Number of post(s) excluded Number of post(s) selected
posted by brand
Nature’s Palette Facebook 72 0 72
Instagram 98 0 98
Twitter 457 6 452
Bougas Beauty Facebook 303 132 171
Instagram 169 6 163
Twitter 55 0 55
Total 1,154 144 1,011
Table 4: Number of sample
4.2.1 VIVIDNESS OF SOCIAL MEDIA CONTENT ON CONSUMERS’ ENGAGEMENT BEHAVIOR
4.2.1.1 Coding the Level of Vividness of Social Media Content
To begin with, turning focus on the vividness of social media content that were coded on grounds of media richness theory that have
been discussed in the literature review, posts with pure text were coded as ‘1’ as no vividness in this study. Out of 1,011 posts, 14.44%
(n=146) posts have been identified as no vividness. This level of vividness of social media content was found only on Twitter of both
brands since the other social media platforms; Facebook and Instagram commonly post their content with pictures or videos.
Posts with photos or images were coded as ‘2’ representing low level of vividness of social media content. In this case, graphic
interchange format (GIF) that is known as a type of image sequence, was also counted as photos or images instead of videos. GIFs were
also mostly found on Twitter as a means for brands to convey emotions and feelings. This level of vividness took up 57.37% (n=580)
from the final sample.
The coding ‘3’ in the category of vividness represents posts with the event held by brands. As an examples taken from this study, the
event that have been mentioned includes product launch, giveaway contest, sales promotion, and collaboration with another brand(s).
In a case in which brand post photos or videos to promote the event, the researcher coded the post according to the highest level of
vividness. For instance, a brand post photos to promote the event, the researcher coded the post as ‘3’; posts with the event instead of
‘2’; posts with videos. The same goes when a brand post videos to promote certain event, the researcher coded the post as ‘4’; posts
260