
Page 285 - MARSIUM'21 COMP OF PAPER
P. 285
4.2.2.2 Interactivity of Social Media Content and Its Corresponding Engagement Metrics
Corresponding engagement metrics
Coding Level of interactivity
Frequency Percentage (%)
Number of like(s) 21863 28.03
Number of comment(s) 10045 37.35
1 No interactivity Number of share(s) 157 48.16
Number of view(s) 157264 22.79
Number of retweet(s) 656 35.06
Number of like(s) 577 0.74
Number of comment(s) 78 0.29
2 Low interactivity Number of share(s) 0 0
Number of view(s) 0 0
Number of retweet(s) 441 23.57
Number of like(s) 17460 22.39
Number of comment(s) 4502 16.74
3 Medium interactivity Number of share(s) 50 15.34
Number of view(s) 51904 7.52
Number of retweet(s) 379 20.26
Number of like(s) 38089 48.84
Number of comment(s) 12272 45.63
4 High interactivity Number of share(s) 119 36.50
Number of view(s) 481006 69.69
Number of retweet(s) 395 21.11
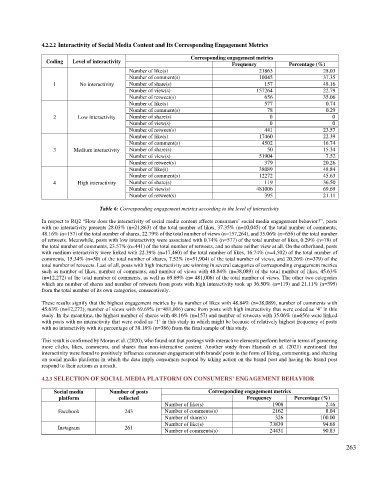
Table 6: Corresponding engagement metrics according to the level of interactivity
In respect to RQ2 “How does the interactivity of social media content affects consumers’ social media engagement behavior?”, posts
with no interactivity presents 28.03% (n=21,863) of the total number of likes, 37.35% (n=10,045) of the total number of comments,
48.16% (n=157) of the total number of shares, 22.79% of the total number of views (n=157,264), and 35.06% (n=656) of the total number
of retweets. Meanwhile, posts with low interactivity were associated with 0.74% (n=577) of the total number of likes, 0.29% (n=78) of
the total number of comments, 23.57% (n=441) of the total number of retweets, and no share neither view at all. On the other hand, posts
with medium interactivity were linked with 22.39% (n=17,460) of the total number of likes, 16.74% (n=4,502) of the total number of
comments, 15.34% (n=50) of the total number of shares, 7.52% (n=51,904) of the total number of views, and 20.26% (n=379) of the
total number of retweets. Last of all, posts with high interactivity are winning in several categories of corresponding engagement metrics
such as number of likes, number of comments, and number of views with 48.84% (n=38,089) of the total number of likes, 45.63%
(n=12,272) of the total number of comments, as well as 69.69% (n= 481,006) of the total number of views. The other two categories
which are number of shares and number of retweets from posts with high interactivity took up 36.50% (n=119) and 21.11% (n=395)
from the total number of its own categories, consecutively.
These results signify that the highest engagement metrics by its number of likes with 48.84% (n=38,089), number of comments with
45.63% (n=12,272), number of views with 69.69% (n=481,006) came from posts with high interactivity that were coded as ‘4’ in this
study. In the meantime, the highest number of shares with 48.16% (n=157) and number of retweets with 35.06% (n=656) were linked
with posts with no interactivity that were coded as ‘1’ in this study in which might be because of relatively highest frequency of posts
with no interactivity with its percentage of 38.18% (n=386) from the final sample of this study.
This result is confirmed by Moran et al. (2020), who found out that postings with interactive elements perform better in terms of garnering
more clicks, likes, comments, and shares than non-interactive content. Another study from Hamzah et al. (2021) mentioned that
interactivity were found to positively influence consumer engagement with brands' posts in the form of liking, commenting, and sharing
on social media platforms in which the data imply consumers respond by taking action on the brand post and having the brand post
respond to their actions as a result.
4.2.3 SELECTION OF SOCIAL MEDIA PLATFORM ON CONSUMERS’ ENGAGEMENT BEHAVIOR
Social media Number of posts Corresponding engagement metrics
platform collected Frequency Percentage (%)
Number of like(s) 1908 2.46
Facebook 243 Number of comments(s) 2162 8.04
Number of share(s) 326 100.00
Number of like(s) 73839 94.68
Instagram 261 Number of comments(s) 24431 90.83
263