
Page 284 - MARSIUM'21 COMP OF PAPER
P. 284
with 49.73% (n=38,785) of the total number of likes, 51.63% (n=13,887) of the total number of comments, 60.43% (n= 197) of the total
number of shares, remarkably high number of views (n=690,174), and 4.76% (n=89) of the total number of retweets.
These results imply that the highest engagement metrics by its number of likes with 49.73% (n=18,785), number of comments with
51.63% (n=13,887), number of shares with 60.43% (n=197), and total views of 690,174 came from posts with high vividness that were
coded as ‘4’ in this study. In the meantime, the highest number of retweets with 64.24% (n=1,202) were linked with posts with low
vividness that were coded as ‘2’ in this study in which might be inclined to relatively high gap between posts which were differentiated
by the level of vividness that were posted by brands on Twitter.
According to the previous research by Moran et al. (2020), across all levels of media richness, brand posts that include rich media formats
receive a higher level of interaction than brand posts that do not include rich media formats in which on this basis, according to media
richness theory, scholars discover that rich media formats (e.g. video) that engage a greater number of senses are extremely effective at
increasing consumer-brand engagement.
4.2.2 INTERACTIVITY OF SOCIAL MEDIA CONTENT ON CONSUMERS’ ENGAGEMENT BEHAVIOR
4.2.2.1 Coding the Level of Interactivity of Social Media Content
Directing the focus on the context of interactivity of social media content, coding was categorized based on the types of interactive
determinant that have been discussed in the literature review. Coding ‘1’ was meant for posts without interactive components as no
interactivity in this study. For this level of interactivity, the researcher identified the posts posted by brand with pure text in which the
characteristic of two-way communication was absence either in its content or caption as no interactivity at all. In this study, out of 1,011
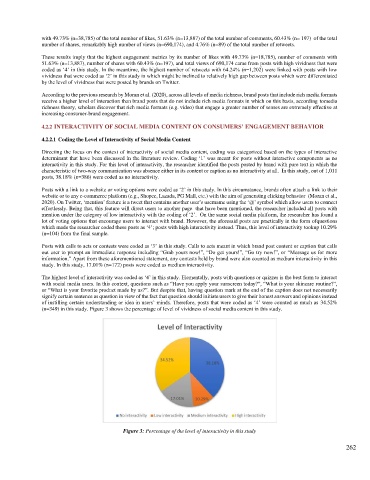
posts, 38.18% (n=386) were coded as no interactivity.
Posts with a link to a website or voting options were coded as ‘2’ in this study. In this circumstance, brands often attach a link to their
website or to any e-commerce platform (e.g., Shopee, Lazada, PG Mall, etc.) with the aim of generating clicking behavior (Moran et al.,
2020). On Twitter, ‘mention’ feature is a tweet that contains another user’s username using the ‘@’ symbol which allow users to connect
effortlessly. Being that, this feature will direct users to another page that have been mentioned, the researcher included all posts with
mention under the category of low interactivity with the coding of ‘2’. On the same social media platform, the researcher has found a
lot of voting options that encourage users to interact with brand. However, the aforesaid posts are practically in the form of questions
which made the researcher coded these posts as ‘4’; posts with high interactivity instead. Thus, this level of interactivity took up 10.29%
(n=104) from the final sample.
Posts with calls to acts or contests were coded as ‘3’ in this study. Calls to acts meant in which brand post content or caption that calls
out user to prompt an immediate response including “Grab yours now!”, “Do get yours!”, “Go try now!”, or “Message us for more
information.” Apart from these aforementioned statement, any contests held by brand were also counted as medium interactivity in this
study. In this study, 17.01% (n=172) posts were coded as medium interactivity.
The highest level of interactivity was coded as ‘4’ in this study. Elementally, posts with questions or quizzes is the best form to interact
with social media users. In this context, questions such as “Have you apply your sunscreen today?”, “What is your skincare routine?”,
or “What is your favorite product made by us?”. But despite that, having question mark at the end of the caption does not necessarily
signify certain sentence as question in view of the fact that question should initiate users to give their honest answers and opinions instead
of instilling certain understanding or idea in users’ minds. Therefore, posts that were coded as ‘4’ were counted as much as 34.52%
(n=349) in this study. Figure 3 shows the percentage of level of vividness of social media content in this study.
Figure 3: Percentage of the level of interactivity in this study
262