
Page 286 - MARSIUM'21 COMP OF PAPER
P. 286
Number of view(s) 690174 100.00
Number of like(s) 2242 2.86
Twitter 507 Number of comments(s) 304 1.13
Number of retweet(s) 1871 100.00
Table 7: Corresponding engagement metrics according to social media platforms
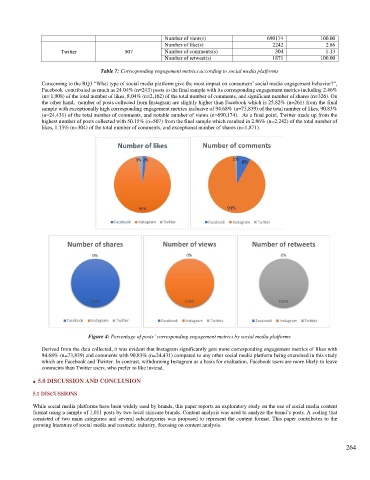
Concerning to the RQ3 “What type of social media platform give the most impact on consumers’ social media engagement behavior?”,
Facebook contributed as much as 24.04% (n=243) posts to the final sample with its corresponding engagement metrics including 2.46%
(n= 1,908) of the total number of likes, 8.04% (n=2,162) of the total number of comments, and significant number of shares (n=326). On
the other hand, number of posts collected from Instagram are slightly higher than Facebook which is 25.82% (n=261) from the final
sample with exceptionally high corresponding engagement metrics inclusive of 94.68% (n=73,839) of the total number of likes, 90.83%
(n=24,431) of the total number of comments, and notable number of views (n=690,174). As a final point, Twitter made up from the
highest number of posts collected with 50.15% (n=507) from the final sample which resulted in 2.86% (n=2,242) of the total number of
likes, 1.13% (n=304) of the total number of comments, and exceptional number of shares (n=1,871).
Figure 4: Percentage of posts’ corresponding engagement metrics by social media platforms
Derived from the data collected, it was evident that Instagram significantly gets more corresponding engagement metrics of likes with
94.68% (n=73,839) and comments with 90.83% (n=24,431) compared to any other social media platform being examined in this study
which are Facebook and Twitter. In contrast, withdrawing Instagram as a basis for evaluation, Facebook users are more likely to leave
comments than Twitter users, who prefer to like instead.
■ 5.0 DISCUSSION AND CONCLUSION
5.1 DISCUSSIONS
While social media platforms have been widely used by brands, this paper reports an exploratory study on the use of social media content
format using a sample of 1,011 posts by two local skincare brands. Content analysis was used to analyze the brand’s posts. A coding that
consisted of two main categories and several subcategories was proposed to represent the content format. This paper contributes to the
growing literature of social media and cosmetic industry, focusing on content analysis.
264