
Page 539 - MARSIUM'21 COMP OF PAPER
P. 539
Ng Wai Teng (2021)
H1
BRAND
H2 CONSUMER
PRICE PURCHASING
INTENTION
H3
TREND
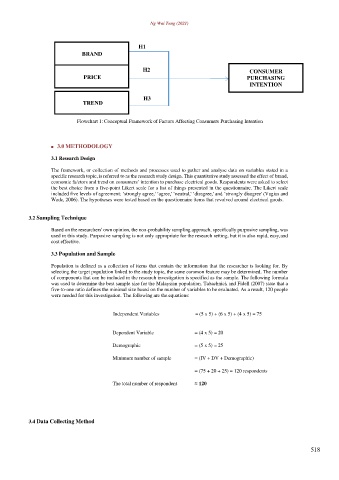
Flowchart 1: Conceptual Framework of Factors Affecting Consumers Purchasing Intention
■ 3.0 METHODOLOGY
3.1 Research Design
The framework, or collection of methods and processes used to gather and analyse data on variables stated in a
specific research topic, is referred to as the research study design. This quantitative study assessed the effect of brand,
economic fa/ctors and trend on consumers’ intention to purchase electrical goods. Respondents were asked to select
the best choice from a five-point Likert scale for a list of things presented in the questionnaire. The Likert scale
included five levels of agreement: ‘strongly agree,' ‘agree,' ‘neutral,' ‘disagree,' and ‘strongly disagree' (Vagias and
Wade, 2006). The hypotheses were tested based on the questionnaire items that revolved around electrical goods.
3.2 Sampling Technique
Based on the researchers' own opinion, the non-probability sampling approach, specifically purposive sampling, was
used in this study. Purposive sampling is not only appropriate for the research setting, but it is also rapid, easy, and
cost effective.
3.3 Population and Sample
Population is defined as a collection of items that contain the information that the researcher is looking for. By
selecting the target population linked to the study topic, the same common feature may be determined. The number
of components that can be included in the research investigation is specified as the sample. The following formula
was used to determine the best sample size for the Malaysian population. Tabachnick and Fidell (2007) state that a
five-to-one ratio defines the minimal size based on the number of variables to be evaluated. As a result, 120 people
were needed for this investigation. The following are the equations:
Independent Variables = (5 x 5) + (6 x 5) + (4 x 5) = 75
Dependent Variable = (4 x 5) = 20
Demographic = (5 x 5) = 25
Minimum number of sample = (IV + DV + Demographic)
= (75 + 20 + 25) = 120 respondents
The total number of respondent ≈ 120
3.4 Data Collecting Method
518