Page 543 - MARSIUM'21 COMP OF PAPER
P. 543

Ng Wai Teng (2021)


              To identify the relationship of brand, price and   Brand, price and trend   Consumer purchasing
                                                                           intentions of Tekpol
              trend with consumer purchasing intentions of                Electric & Supply Sdn   Multiple Regression
                  Tekpol Electric & Supply Sdn Bhd.
                                                                                 Bhd

                To investigate the most important factor                  Consumer purchasing
            influencing consumer purchase intention of Tekpol   Brand, price and trend   intentions of Tekpol   Beta Coefficient (β)
                     Electric & Supply Sdn Bhd.                           Electric & Supply Sdn
                                                                                 Bhd


              To determine whether social media marketing                 Consumer purchasing
             improve consumer purchase intention of Tekpol   Intervention – Social   intentions of Tekpol
                     Electric & Supply Sdn Bhd.        Media Marketing    Electric & Supply Sdn   Paired Samples T-test
                                                                                 Bhd

                                              Table 4.1: Summary of Statistical Tests


                   4.1 Descriptive Analysis

                   4.1.1 Respondents Background
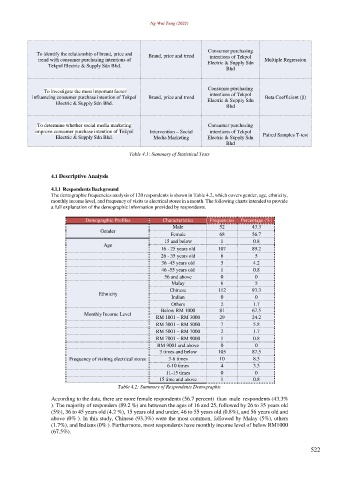
                   The demographic frequencies analysis of 120 respondents is shown in Table 4.2, which covers gender, age, ethnicity,
                   monthly income level, and frequency of visits to electrical stores in a month. The following charts intended to provide
                   a full explanation of the demographic information provided by respondents.

                               Demographic Profiles       Characteristics   Frequencies  Percentage (%)
                                                              Male            52          43.3
                                    Gender
                                                             Female           68          56.7
                                                           15 and below        1          0.8
                                     Age
                                                          16 - 25 years old   107         89.2
                                                          26 - 35 years old    6           5
                                                          36 -45 years old     5          4.2
                                                          46 -55 years old     1          0.8
                                                           56 and above        0           0
                                                             Malay             6           5
                                                             Chinese          112         93.3
                                    Ethnicity
                                                             Indian            0           0
                                                             Others            2          1.7
                                                          Below RM 1000       81          67.5
                               Monthly Income Level
                                                        RM 1001 – RM 3000     29          24.2
                                                        RM 3001 – RM 5000      7          5.8
                                                        RM 5001 – RM 7000      2          1.7
                                                        RM 7001 – RM 9000      1          0.8
                                                        RM 9001 and above      0           0
                                                         3 times and below    105         87.5
                         Frequency of visiting electrical stores   3-6 times   10         8.3
                                                            6-10 times         4          3.3
                                                           11-15 times         0           0
                                                         15 time and above     1          0.8
                                          Table 4.2: Summary of Respondents Demographic

                   According to the data, there are more female respondents (56.7 percent)  than  male  respondents (43.3%
                   ). The majority of responders (89.2 %) are between the ages of 16 and 25, followed by 26 to 35 years old
                   (5%), 36 to 45 years old (4.2 %), 15 years old and under, 46 to 55 years old (0.8%), and 56 years old and
                   above (0% ). In this study, Chinese (93.3%) were the most common, followed by Malay (5%), others
                   (1.7%), and Indians (0% ). Furthermore, most respondents have monthly income level of below RM1000
                   (67.5%).


                                                                                                              522
   538   539   540   541   542   543   544   545   546   547   548