
Page 542 - MARSIUM'21 COMP OF PAPER
P. 542
Ng Wai Teng (2021)
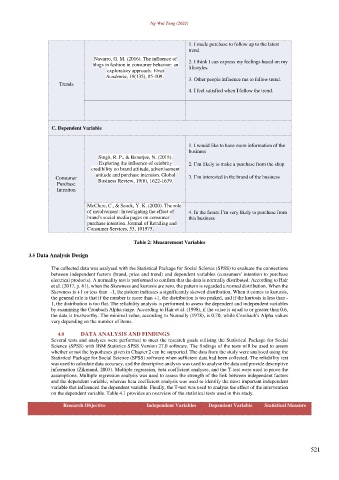
1. I made purchase to follow up to the latest
trend.
Navarro, G. M. (2016). The influence of
blogs in fashion in consumer behavior: an 2. I think I can express my feelings based on my
exploratory approach. Vivat lifestyles.
Academia, 19(135), 85-109. 3. Other people influence me to follow trend.
Trends
4. I feel satisfied when I follow the trend.
C. Dependent Variable
1. I would like to have more information of the
business
Singh, R. P., & Banerjee, N. (2018).
Exploring the influence of celebrity 2. I’m likely to make a purchase from the shop
credibility on brand attitude, advertisement
Consumer attitude and purchase intention. Global 3. I’m interested in the brand of the business
Business Review, 19(6), 1622-1639.
Purchase
Intention
McClure, C., & Seock, Y. K. (2020). The role
of involvement: Investigating the effect of 4. In the future I’m very likely to purchase from
brand's social media pages on consumer this business
purchase intention. Journal of Retailing and
Consumer Services, 53, 101975.
Table 2: Measurement Variables
3.5 Data Analysis Design
The collected data was analysed with the Statistical Package for Social Science (SPSS) to evaluate the connections
between independent factors (brand, price and trend) and dependent variables (consumers' intention to purchase
electrical products). A normality test is performed to confirm that the data is normally distributed. According to Hair
et al. (2017, p. 61), when the Skewness and kurtosis are zero, the pattern is regarded a normal distribution. When the
Skewness is +1 or less than -1, the pattern indicates a significantly skewed distribution. When it comes to kurtosis,
the general rule is that if the number is more than +1, the distribution is too peaked, and if the kurtosis is less than -
1, the distribution is too flat. The reliability analysis is performed to assess the dependent and independent variables
by examining the Cronbach Alpha range. According to Hair et al. (1998), if the value is equal to or greater than 0.6,
the data is trustworthy. The minimal value, according to Nunnally (1978), is 0.70, while Cronbach's Alpha values
vary depending on the number of items.
4.0 DATA ANALYSIS AND FINDINGS
Several tests and analyses were performed to meet the research goals utilising the Statistical Package for Social
Science (SPSS) with IBM Statistics SPSS Version 27.0 software. The findings of the tests will be used to assess
whether or not the hypotheses given in Chapter 2 can be supported. The data from the study were analysed using the
Statistical Package for Social Science (SPSS) software when sufficient data had been collected. The reliability test
was used to calculate data accuracy, and the descriptive analysis was used to analyse the data and provide descriptive
information (Zikmund, 2003). Multiple regression, beta coefficient analyses, and the T-test were used to prove the
assumptions. Multiple regression analysis was used to assess the strength of the link between independent factors
and the dependent variable, whereas beta coefficient analysis was used to identify the most important independent
variable that influenced the dependent variable. Finally, the T-test was used to analyse the effect of the intervention
on the dependent variable. Table 4.1 provides an overview of the statistical tests used in this study.
Research Objective Independent Variables Dependent Variable Statistical Measure
521