Page 675 - MARSIUM'21 COMP OF PAPER
P. 675

654                                        Nursahira (2021)


            ■  4.0  DATA ANALYSIS
            The sample size decided for this research is to be 100 respondents from undergraduates student in UTM. They may have seen or never
            seen the Keris Siamang Tunggal movie before.

            4.1  Descriptive Analysis

               4.1.1 Demographic Profile of Respondent

               This study manages to collect the respondent demographics based on the gender, age, ethnicity, faculty of study and income level.
               Table 4.1 is the demographic data to be collected in this study.

               Table 4.1: Statistics
                Statistics           Gender       Age         Ethnicity    Faculty      Income level /
                                                                                        Allowance
                                                                                        (monthly basis)
                N         Valid      100          100         100          100          100
                          Missing    0            0           0            0            0
                          Source: Result from the research project


               4.1.1.1 Gender

               Table 4.2: Gender
                                      Frequency    Percent      Cumulative
                                                                Percent
                   Valid    Female    47           47.0         47.0
                            Male      53           53.0         100.0
                            Total     100          100.0
               Source: Result from the research project
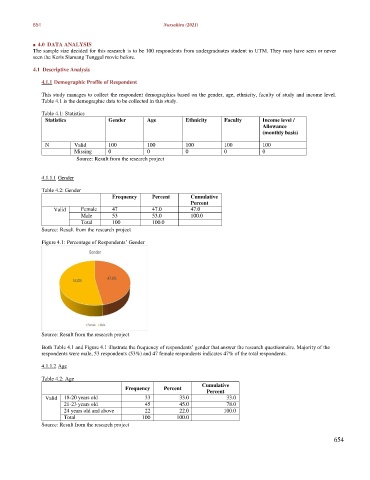
               Figure 4.1: Percentage of Respondents’ Gender


               Source: Result from the research project

               Both Table 4.1 and Figure 4.1 illustrate the frequency of respondents’ gender that answer the research questionnaire. Majority of the
               respondents were male, 53 respondents (53%) and 47 female respondents indicates 47% of the total respondents.

               4.1.1.2 Age

               Table 4.2: Age
                                                                    Cumulative
                                          Frequency    Percent
                                                                     Percent
                Valid  18-20 years old           33         33.0            33.0
                      21-23 years old            45         45.0            78.0
                      24 years old and above     22         22.0           100.0
                      Total                     100        100.0
               Source: Result from the research project

                                                                                                                654
   670   671   672   673   674   675   676   677   678   679   680