
Page 676 - MARSIUM'21 COMP OF PAPER
P. 676
655 Nursahira (2021)
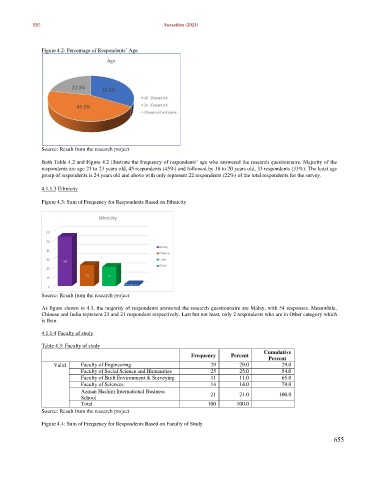
Figure 4.2: Percentage of Respondents’ Age
Source: Result from the research project
Both Table 4.2 and Figure 4.2 illustrate the frequency of respondents’ age who answered the research questionnaire. Majority of the
respondents are age 21 to 23 years old, 45 respondents (45%) and followed by 18 to 20 years old, 33 respondents (33%). The least age
group of respondents is 24 years old and above with only represent 22 respondents (22%) of the total respondents for the survey.
4.1.1.3 Ethnicity
Figure 4.3: Sum of Frequency for Respondents Based on Ethnicity
Source: Result from the research project
As figure shown in 4.3, the majority of respondents answered the research questionnaire are Malay, with 54 responses. Meanwhile,
Chinese and India represent 23 and 21 respondent respectively. Last but not least, only 2 respondents who are in Other category which
is Iban.
4.1.1.4 Faculty of study
Table 4.3: Faculty of study
Cumulative
Frequency Percent
Percent
Valid Faculty of Engineering 29 29.0 29.0
Faculty of Social Science and Humanities 25 25.0 54.0
Faculty of Built Environment & Surveying 11 11.0 65.0
Faculty of Sciences 14 14.0 79.0
Azman Hashim International Business 21 21.0 100.0
School
Total 100 100.0
Source: Result from the research project
Figure 4.4: Sum of Frequency for Respondents Based on Faculty of Study
655