
Page 680 - MARSIUM'21 COMP OF PAPER
P. 680
659 Nursahira (2021)
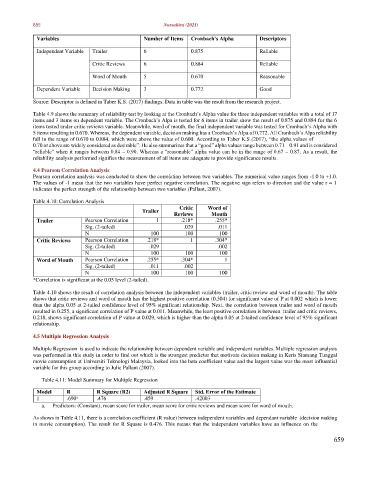
Variables Number of Items Cronbach’s Alpha Descriptors
Independent Variable Trailer 6 0.875 Reliable
Critic Reviews 6 0.884 Reliable
Word of Mouth 5 0.670 Reasonable
Dependent Variable Decision Making 3 0.772 Good
Source: Descriptor is defined in Taber K.S. (2017) findings. Data in table was the result from the research project.
Table 4.9 shows the summary of reliability test by looking at the Cronbach’s Alpha value for three independent variables with a total of 17
items and 3 items on dependent variable. The Cronbach’s Alpa is tested for 6 items in trailer show the result of 0.875 and 0.884 for the 6
items tested under critic reviews variable. Meanwhile, word of mouth, the final independent variable was tested for Cronbach’s Alpha with
5 items resulting in 0.670. Whereas, the dependent variable, decision making has a Cronbach’s Alpa of 0.772. All Cronbach’s Alpa reliability
fall in the range of 0.670 to 0.884, which were above the value of 0.600. According to Taber K.S (2017), “the alpha values of
0.70 or above are widely considered as desirable”. He also summarizes that a “good” alpha values range between 0.71 – 0.91 and is considered
“reliable” when it ranges between 0.84 – 0.90. Whereas a “reasonable” alpha value can be in the range of 0.67 – 0.87. As a result, the
reliability analysis performed signifies the measurement of all items are adequate to provide significance results.
4.4 Pearson Correlation Analysis
Pearson correlation analysis was conducted to show the correlation between two variables. The numerical value ranges from -1.0 to +1.0.
The values of -1 mean that the two variables have perfect negative correlation. The negative sign refers to direction and the value r = 1
indicates the perfect strength of the relationship between two variables (Pallant, 2007).
Table 4.10: Correlation Analysis
Critic Word of
Trailer
Reviews Mouth
Trailer Pearson Correlation 1 .218* .255*
Sig. (2-tailed) .029 .011
N 100 100 100
Critic Reviews Pearson Correlation .218* 1 .304*
Sig. (2-tailed) .029 .002
N 100 100 100
Word of Mouth Pearson Correlation .255* .304* 1
Sig. (2-tailed) .011 .002
N 100 100 100
*Correlation is significant at the 0.05 level (2-tailed).
Table 4.10 shows the result of correlation analysis between the independent variables (trailer, critic review and word of mouth). The table
shows that critic reviews and word of mouth has the highest positive correlation (0.304) for significant value of P at 0.002 which is lower
than the alpha 0.05 at 2-tailed confidence level of 95% significant relationship. Next, the correlation between trailer and word of mouth
resulted in 0.255, a significant correlation of P value at 0.011. Meanwhile, the least positive correlation is between trailer and critic reviews,
0.218, shows significant correlation of P value at 0.029, which is higher than the alpha 0.05 at 2-tailed confidence level of 95% significant
relationship.
4.5 Multiple Regression Analysis
Multiple Regression is used to indicate the relationship between dependent variable and independent variables. Multiple regression analysis
was performed in this study in order to find out which is the strongest predictor that motivate decision making in Keris Siamang Tunggal
movie consumption at Universiti Teknologi Malaysia, looked into the beta coefficient value and the largest value was the most influential
variable for this group according to Julie Pallant (2007).
Table 4.11: Model Summary for Multiple Regression
Model R R Square (R2) Adjusted R Square Std. Error of the Estimate
1 .690 .476 .459 .42003
a
a. Predictors: (Constant), mean score for trailer, mean score for critic reviews and mean score for word of mouth.
As shows in Table 4.11, there is a correlation coefficient (R value) between independent variables and dependant variable (decision making
in movie consumption). The result for R Square is 0.476. This means that the independent variables have an influence on the
659