
Page 679 - MARSIUM'21 COMP OF PAPER
P. 679
658 Nursahira (2021)
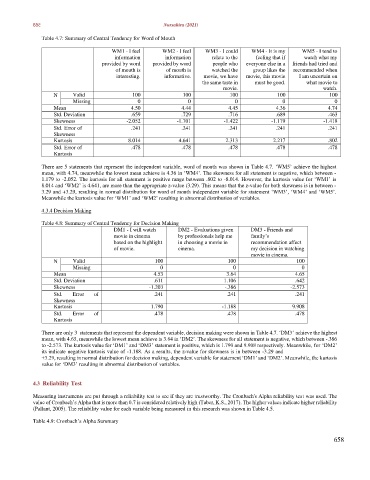
Table 4.7: Summary of Central Tendency for Word of Mouth
WM1 - I feel WM2 - I feel WM3 - I could WM4 - It is my WM5 - I tend to
information information relate to the feeling that if watch what my
provided by word provided by word people who everyone else in a friends had tried and
of mouth is of mouth is watched the group likes the recommended when
interesting. informative. movie, we have movie, this movie I am uncertain on
the same taste in must be good. what movie to
movie. watch.
N Valid 100 100 100 100 100
Missing 0 0 0 0 0
Mean 4.50 4.44 4.45 4.36 4.74
Std. Deviation .659 .729 .716 .689 .463
Skewness -2.052 -1.701 -1.422 -1.179 -1.418
Std. Error of .241 .241 .241 .241 .241
Skewness
Kurtosis 8.014 4.641 2.313 2.217 .802
Std. Error of .478 .478 .478 .478 .478
Kurtosis
There are 5 statements that represent the independent variable, word of mouth was shown in Table 4.7. ‘WM5’ achieve the highest
mean, with 4.74, meanwhile the lowest mean achieve is 4.36 in ‘WM4’. The skewness for all statement is negative, which between -
1.179 to -2.052. The kurtosis for all statement is positive range between .802 to -8.014. However, the kurtosis value for ‘WM1’ is
8.014 and ‘WM2’ is 4.641, are more than the appropriate z-value (3.29). This means that the z-value for both skewness is in between -
3.29 and +3.29, resulting in normal distribution for word of mouth independent variable for statement ‘WM3’, ‘WM4’ and ‘WM5’.
Meanwhile the kurtosis value for ‘WM1’ and ‘WM2’ resulting in abnormal distribution of variables.
4.3.4 Decision Making
Table 4.8: Summary of Central Tendency for Decision Making
DM1 - I will watch DM2 - Evaluations given DM3 - Friends and
movie in cinema by professionals help me family’s
based on the highlight in choosing a movie in recommendation affect
of movie. cinema. my decision in watching
movie in cinema.
N Valid 100 100 100
Missing 0 0 0
Mean 4.53 3.64 4.65
Std. Deviation .611 1.106 .642
Skewness -1.203 -.386 -2.573
Std. Error of .241 .241 .241
Skewness
Kurtosis 1.790 -1.188 9.908
Std. Error of .478 .478 .478
Kurtosis
There are only 3 statements that represent the dependent variable, decision making were shown in Table 4.7. ‘DM3’ achieve the highest
mean, with 4.65, meanwhile the lowest mean achieve is 3.64 in ‘DM2’. The skewness for all statement is negative, which between -.386
to -2.573. The kurtosis value for ‘DM1’ and ‘DM3’ statement is positive, which is 1.790 and 9.908 respectively. Meanwhile, for ‘DM2’
its indicate negative kurtosis value of -1.188. As a results, the z-value for skewness is in between -3.29 and
+3.29, resulting in normal distribution for decision making, dependent variable for statement ‘DM1’ and ‘DM2’. Meanwhile, the kurtosis
value for ‘DM3’ resulting in abnormal distribution of variables.
4.3 Reliability Test
Measuring instruments are put through a reliability test to see if they are trustworthy. The Cronbach's Alpha reliability test was used. The
value of Cronbach’s Alpha that is more than 0.7 is considered relatively high (Taber, K.S., 2017). The higher values indicate higher reliability
(Pallant, 2005). The reliability value for each variable being measured in this research was shown in Table 4.5.
Table 4.9: Cronbach’s Alpha Summary
658