
Page 677 - MARSIUM'21 COMP OF PAPER
P. 677
656 Nursahira (2021)
Source: Result from the research project
Data shown in Table 4.3 and Figure 4.4 represent the sum of frequency for respondents who have answered the research questionnaire
based on their faculty of study in UTM. Majority of the respondents are from Faculty of Engineering, with 29 respondents. This can be
explained by the population of Engineering course students is bigger than other course. Then, there are 25 respondents who are from
Faculty of Social Science and Humanities, followed by 21 respondents from Azman Hashim International Business School and 14
respondents from Faculty of Science. Lastly, there are 11 respondents who participated in the research which represent Faculty of Built
Environment and Surveyings.
4.1.1.5 Income level/ Allowance (monthly basis)
Table 4.4: Income level/ allowance of respondents
Cumulative
Frequency Percent
Percent
Valid Below RM500 62 62.0 62.0
RM500 – RM1000 26 26.0 88.0
RM1001 – RM2000 7 7.0 95.0
Above RM2000 5 5.0 100.0
Total 100 100.0
Source: Result from the research project
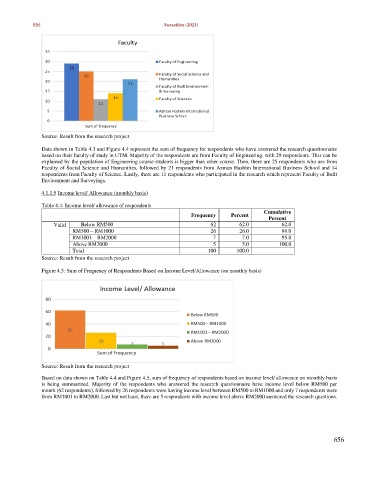
Figure 4.5: Sum of Frequency of Respondents Based on Income Level/Allowance (on monthly basis)
Source: Result from the research project
Based on data shown on Table 4.4 and Figure 4.5, sum of frequency of respondents based on income level/ allowance on monthly basis
is being summarized. Majority of the respondents who answered the research questionnaire have income level below RM500 per
month (62 respondents), followed by 26 respondents were having income level between RM500 to RM1000 and only 7 respondents were
from RM1001 to RM2000. Last but not least, there are 5 respondents with income level above RM2000 answered the research questions.
656