
Page 678 - MARSIUM'21 COMP OF PAPER
P. 678
657 Nursahira (2021)
4.2 Normality test
In order to determine if all of the data collected is normally distributed, a normality test is carried out. Normal distribution is assumed for
Skewness and Kurtosis for values of variables is between -3.29 and +3.29 for sample size range between 50 to 300 (Mishra, et al., 2019).
4.2.1 Trailer
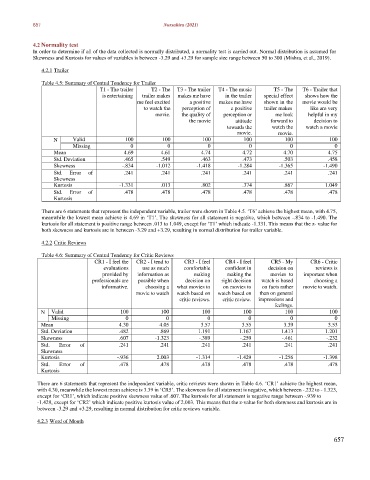
Table 4.5: Summary of Central Tendency for Trailer
T1 - The trailer T2 - The T3 - The trailer T4 - The music T5 - The T6 - Trailer that
is entertaining trailer makes makes me have in the trailer special effect shows how the
me feel excited a positive makes me have shown in the movie would be
to watch the perception of a positive trailer makes like are very
movie. the quality of perception or me look helpful in my
the movie attitude forward to decision to
towards the watch the watch a movie
movie. movie.
N Valid 100 100 100 100 100 100
Missing 0 0 0 0 0 0
Mean 4.69 4.61 4.74 4.72 4.70 4.75
Std. Deviation .465 .549 .463 .473 .503 .458
Skewness -.834 -1.012 -1.418 -1.284 -1.365 -1.490
Std. Error of .241 .241 .241 .241 .241 .241
Skewness
Kurtosis -1.331 .013 .802 .374 .867 1.049
Std. Error of .478 .478 .478 .478 .478 .478
Kurtosis
There are 6 statements that represent the independent variable, trailer were shown in Table 4.5. ‘T6’ achieve the highest mean, with 4.75,
meanwhile the lowest mean achieve is 4.69 in ‘T1’. The skewness for all statement is negative, which between -.834 to -1.490. The
kurtosis for all statement is positive range between .013 to 1.049, except for ‘T1’ which indicate -1.331. This means that the z- value for
both skewness and kurtosis are in between -3.29 and +3.29, resulting in normal distribution for trailer variable.
4.2.2 Critic Reviews
Table 4.6: Summary of Central Tendency for Critic Reviews
CR1 - I feel the CR2 - I tend to CR3 - I feel CR4 - I feel CR5 - My CR6 - Critic
evaluations use as much comfortable confident in decision on reviews is
provided by information as making making the movies to important when
professionals are possible when decision on right decision watch is based choosing a
informative. choosing a what movies to on movies to on facts rather movie to watch.
movie to watch watch based on watch based on than on general
critic reviews. critic review. impressions and
feelings.
N Valid 100 100 100 100 100 100
Missing 0 0 0 0 0 0
Mean 4.30 4.05 3.57 3.55 3.39 3.53
Std. Deviation .482 .869 1.191 1.167 1.413 1.201
Skewness .607 -1.323 -.389 -.259 -.461 -.232
Std. Error of .241 .241 .241 .241 .241 .241
Skewness
Kurtosis -.936 2.003 -1.314 -1.429 -1.256 -1.398
Std. Error of .478 .478 .478 .478 .478 .478
Kurtosis
There are 6 statements that represent the independent variable, critic reviews were shown in Table 4.6. ‘CR1’ achieve the highest mean,
with 4.30, meanwhile the lowest mean achieve is 3.39 in ‘CR5’. The skewness for all statement is negative, which between -.232 to - 1.323,
except for ‘CR1’, which indicate positive skewness value of .607. The kurtosis for all statement is negative range between -.939 to
-1.429, except for ‘CR2’ which indicate positive kurtosis value of 2.003. This means that the z-value for both skewness and kurtosis are in
between -3.29 and +3.29, resulting in normal distribution for critic reviews variable.
4.2.3 Word of Mouth
657