
Page 959 - MARSIUM'21 COMP OF PAPER
P. 959
960 Woon & Grace (2022)
■ 4.0 DATA ANALYSIS
4.1 RESPONSE RATE
The study's findings used quantitative and qualitative questions to examine brand awareness, brand association, perceived quality, and
brand attitude as independent variables and their impact on purchase intention for My-Robot Robotics Academy. The questionnaire was
distributed using google form and sent to the 200 Malaysian parents who have children aged 5-15 years old via social media channels such
as Facebook, WhatsApp and Instagram. In overview, 275 sets of responses were received, and 75 invalid respondents did not fulfil the
qualifying questions as they were never heard about the My Robot’s brand. Therefore, the respondent's rate for this study was 72.73%, with
200 valid respondents.
4.2 PROFILE OF RESPONDENTS
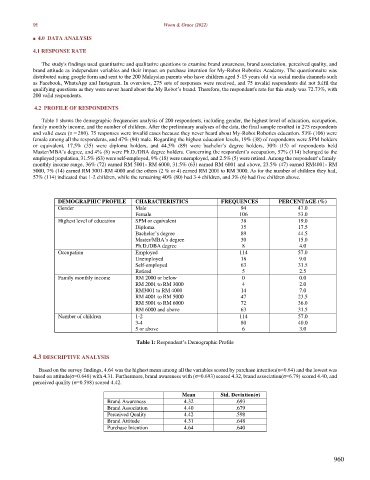
Table 1 shows the demographic frequencies analysis of 200 respondents, including gender, the highest level of education, occupation,
family monthly income, and the number of children. After the preliminary analyses of the data, the final sample resulted in 275 respondents
and valid cases (n = 200). 75 responses were invalid cases because they never heard about My-Robot Robotics education. 53% (106) were
female among all the respondents, and 47% (94) male. Regarding the highest education levels, 19% (38) of respondents were SPM holders
or equivalent, 17.5% (35) were diploma holders, and 44.5% (89) were bachelor’s degree holders, 30% (15) of respondents held
Master/MBA’s degree, and 4% (8) were Ph.D./DBA degree holders. Concerning the respondent’s occupation, 57% (114) belonged to the
employed population, 31.5% (63) were self-employed, 9% (18) were unemployed, and 2.5% (5) were retired. Among the respondent’s family
monthly income range, 36% (72) earned RM 5001- RM 6000, 31.5% (63) earned RM 6001 and above, 23.5% (47) earned RM4001- RM
5000, 7% (14) earned RM 3001-RM 4000 and the others (2 % or 4) earned RM 2001 to RM 3000. As for the number of children they had,
57% (114) indicated that 1-2 children, while the remaining 40% (80) had 3-4 children, and 3% (6) had five children above.
DEMOGRAPHIC PROFILE CHARACTERISTICS FREQUENCES PERCENTAGE (%)
Gender Male 94 47.0
Female 106 53.0
Highest level of education SPM or equivalent 38 19.0
Diploma 35 17.5
Bachelor’s degree 89 44.5
Master/MBA’s degree 30 15.0
Ph.D./DBA degree 8 4.0
Occupation Employed 114 57.0
Unemployed 18 9.0
Self-employed 63 31.5
Retired 5 2.5
Family monthly income RM 2000 or below 0 0.0
RM 2001 to RM 3000 4 2.0
RM3001 to RM 4000 14 7.0
RM 4001 to RM 5000 47 23.5
RM 5001 to RM 6000 72 36.0
RM 6000 and above 63 31.5
Number of children 1-2 114 57.0
3-4 80 40.0
5 or above 6 3.0
Table 1: Respondent’s Demographic Profile
4.3 DESCRIPTIVE ANALYSIS
Based on the survey findings, 4.64 was the highest mean among all the variables scored by purchase intention(σ=0.64) and the lowest was
based on attitude(σ=0.648) with 4.31. Furthermore, brand awareness with (σ=0.693) scored 4.32, brand association(σ=6.79) scored 4.40, and
perceived quality (σ=0.598) scored 4.42.
Mean Std. Deviation(σ)
Brand Awareness 4.32 .693
Brand Association 4.40 .679
Perceived Quality 4.42 .598
Brand Attitude 4.31 .648
Purchase Intention 4.64 .640
960