
Page 960 - MARSIUM'21 COMP OF PAPER
P. 960
961 Woon & Grace (2022)
Table 1: Descriptive analysis
4.4 SCALE MEASUREMENT
4.4.1 NORMALITY TEST
The first stage in the data test is to analyse the normality of the data. The normal distribution is a continuous asymmetric distribution
characterised by the data’s mean and standard deviation. Analysing data for normality is necessary for many statistical tests, as standard data
is fundamental in parametric testing. The two primary approaches for determining normality are graphical and numerical (including t-test).
Skewness and kurtosis were used to determine whether data sets have a normal distribution when performing normality tests. Ho and Yu
(2015) specified that the skewness and kurtosis were executed as an early investigation for multivariate typicality. According to Kim (2013),
skewness refers to the total of a variable's dissemination asymmetry, while kurtosis refers to the degree of peakedness for a dispersion. Hair
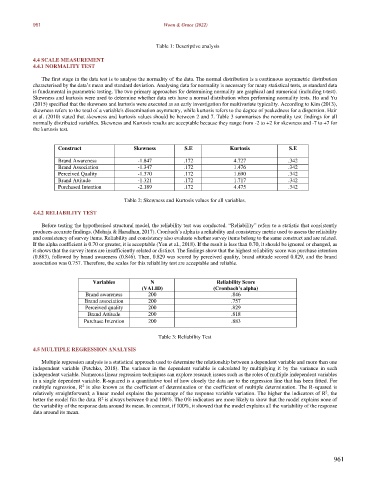
et al. (2010) stated that skewness and kurtosis values should be between 2 and 7. Table 3 summarises the normality test findings for all
normally distributed variables. Skewness and Kurtosis results are acceptable because they range from -2 to +2 for skewness and -7 to +7 for
the kurtosis test.
Construct Skewness S.E Kurtosis S.E
Brand Awareness -1.847 .172 4.727 .342
Brand Association -1.347 .172 1.476 .342
Perceived Quality -1.370 .172 1.690 .342
Brand Attitude -1.321 .172 1.717 .342
Purchased Intention -2.189 .172 4.475 .342
Table 2: Skewness and Kurtosis values for all variables.
4.4.2 RELIABILITY TEST
Before testing the hypothesised structural model, the reliability test was conducted. “Reliability” refers to a statistic that consistently
produces accurate findings. (Mohaja & Haradhan, 2017). Cronbach’s alpha is a reliability and consistency metric used to assess the reliability
and consistency of survey items. Reliability and consistency also evaluate whether survey items belong to the same construct and are related.
If the alpha coefficient is 0.70 or greater, it is acceptable (Yen et al., 2018). If the result is less than 0.70, it should be ignored or changed, as
it shows that the survey items are insufficiently related or distinct. The findings show that the highest reliability score was purchase intention
(0.883), followed by brand awareness (0.846). Then, 0.829 was scored by perceived quality, brand attitude scored 0.829, and the brand
association was 0.757. Therefore, the scales for this reliability test are acceptable and reliable.
Variables N Reliability Score
(VALID) (Cronbach’s alpha)
Brand awareness 200 .846
Brand association 200 .757
Perceived quality 200 .829
Brand Attitude 200 .818
Purchase Intention 200 .883
Table 3: Reliability Test
4.5 MULTIPLE REGRESSION ANALYSIS
Multiple regression analysis is a statistical approach used to determine the relationship between a dependent variable and more than one
independent variable (Petchko, 2018). The variance in the dependent variable is calculated by multiplying it by the variance in each
independent variable. Numerous linear regression techniques can explore research issues such as the roles of multiple independent variables
in a single dependent variable. R-squared is a quantitative tool of how closely the data are to the regression line that has been fitted. For
multiple regression, R is also known as the coefficient of determination or the coefficient of multiple determination. The R-squared is
2
2
relatively straightforward; a linear model explains the percentage of the response variable variation. The higher the indicators of R , the
better the model fits the data. R is always between 0 and 100%. The 0% indicators are more likely to show that the model explains none of
2
the variability of the response data around its mean. In contrast, if 100%, it showed that the model explains all the variability of the response
data around its mean.
961