
Page 961 - MARSIUM'21 COMP OF PAPER
P. 961
962 Woon & Grace (2022)
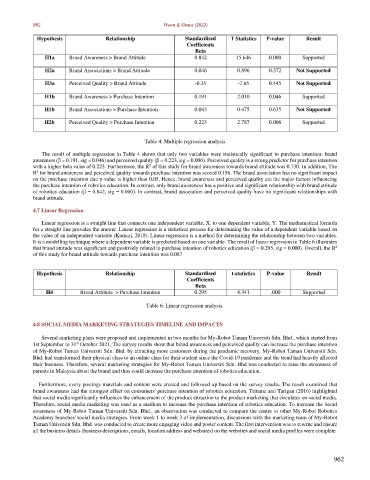
Hypothesis Relationship Standardised T Statistics P-value Result
Coefficients
Beta
H1a Brand Awareness > Brand Attitude 0.842 15.646 0.000 Supported
H2a Brand Associations > Brand Attitude 0.046 0.896 0.372 Not Supported
H3a Perceived Quality > Brand Attitude -0.35 -7.65 0.445 Not Supported
H1b Brand Awareness > Purchase Intention 0.191 2.010 0.046 Supported
H1b Brand Associations > Purchase Intention 0.043 0.475 0.635 Not Supported
H2b Perceived Quality > Purchase Intention 0.223 2.787 0.006 Supported
Table 4: Multiple regression analysis
The result of multiple regression in Table 4 shows that only two variables were statistically significant to purchase intention: brand
awareness (β = 0.191, sig = 0.046) and perceived quality (β = 0.223, sig = 0.006). Perceived quality is a strong predictor for purchase intention
2
with a higher beta value of 0.223. Furthermore, the R of this study for brand awareness towards brand attitude was 0.730. In addition, The
R for brand awareness and perceived quality towards purchase intention was scored 0.156. The brand association has no significant impact
2
on the purchase intention due p-value is higher than 0.05. Hence, brand awareness and perceived quality are the major factors influencing
the purchase intention of robotics education. In contrast, only brand awareness has a positive and significant relationship with brand attitude
of robotics education (β = 0.842, sig = 0.000). In contrast, brand association and perceived quality have no significant relationships with
brand attitude.
4.7 Linear Regression
Linear regression is a straight line that connects one independent variable, X, to one dependent variable, Y. The mathematical formula
for a straight line provides the answer. Linear regression is a statistical process for determining the value of a dependent variable based on
the value of an independent variable (Kumari, 2018). Linear regression is a method for determining the relationship between two variables.
It is a modelling technique where a dependent variable is predicted based on one variable. The result of linear regression in Table 6 illustrates
that brand attitude was significant and positively related to purchase intention of robotics education (β = 0.295, sig = 0.000). Overall, the R
2
of this study for brand attitude towards purchase intention was 0.087
Hypothesis Relationship Standardised t-statistics P-value Result
Coefficients
Beta
H4 Brand Attitude > Purchase Intention 0.295 4.341 .000 Supported
Table 6: Linear regression analysis.
4.8 SOCIAL MEDIA MARKETING STRATEGIES TIMELINE AND IMPACTS
Several marketing plans were proposed and implemented in two months for My-Robot Taman Universiti Sdn. Bhd., which started from
st
1st September to 31 October 2021. The survey results show that brand awareness and perceived quality can increase the purchase intention
of My-Robot Taman Universiti Sdn. Bhd. by attracting more customers during the pandemic recovery. My-Robot Taman Universiti Sdn.
Bhd. had transformed their physical class to an online class for their student since the Covid-19 pandemic and the trend had heavily affected
their business. Therefore, several marketing strategies for My-Robot Taman Universiti Sdn. Bhd was conducted to raise the awareness of
parents in Malaysia about the brand and thus could increase the purchase intention of robotics education.
Furthermore, every postings materials and content were created and followed up based on the survey results. The result examined that
brand awareness had the strongest effect on consumers' purchase intention of robotics education. Tritama and Tarigan (2016) highlighted
that social media significantly influences the enhancement of the product attraction to the product marketing that circulates on social media.
Therefore, social media marketing was used as a medium to increase the purchase intention of robotics education. To increase the brand
awareness of My-Robot Taman Universiti Sdn. Bhd., an observation was conducted to compare the centre to other My-Robot Robotics
Academy branches' social media strategies. From week 1 to week 3 of implementation, discussions with the marketing team of My-Robot
Taman Universiti Sdn. Bhd. was conducted to create more engaging video and poster content. The first intervention was to rewrite and ensure
all the business details (business descriptions, emails, location address and websites) on the websites and social media profiles were complete
962