
Page 130 - ANUAL REPORT MOH 2017
P. 130
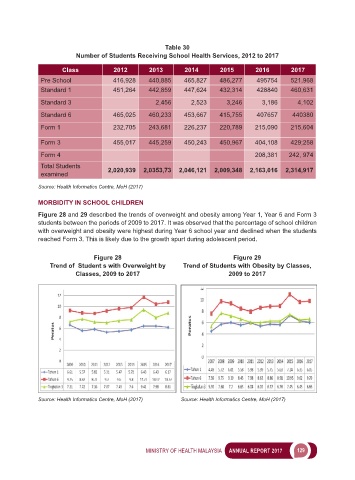
Table 30
                         Number of Students Receiving School Health Services, 2012 to 2017

                     Class           2012        2013       2014       2015        2016       2017
              Pre School             416,928     440,885    465,827    486,277     495754     521,968
              Standard 1             451,264     442,859    447,624    432,314     428840     460,631

              Standard 3                           2,456      2,523      3,246       3,186      4,102
              Standard 6             465,025     460,233    453,667    415,755     407657     440380
              Form 1                 232,705     243,681    226,237    220,789    215,090     215,604


              Form 3                 455,017     445,259    450,243    450,967    404,108     429;258
              Form 4                                                              208,381    242, 974
              Total Students
              examined              2,020,939  2,0353,73  2,046,121   2,009,348  2,163,016  2,314,917
             Source: Health Informatics Centre, MoH (2017)


             MORBIDITY IN SCHOOL CHILDREN
             Figure 28 and 29 described the trends of overweight and obesity among Year 1, Year 6 and Form 3
             students between the periods of 2009 to 2017. It was observed that the percentage of school children
             with overweight and obesity were highest during Year 6 school year and declined when the students
             reached Form 3. This is likely due to the growth spurt during adolescent period.

                               Figure 28                                    Figure 29
                 Trend of  Student s with Overweight by    Trend of Students with Obesity by Classes,
                         Classes, 2009 to 2017                            2009 to 2017


             Source: Health Informatics Centre, MoH (2017)   Source: Health Informatics Centre, MoH (2017)


                                                MINISTRY OF HEALTH MALAYSIA     ANNUAL REPORT 2017       129