
Page 56 - Class-11-Physics-Part-1_Neat
P. 56
42 PHYSICS
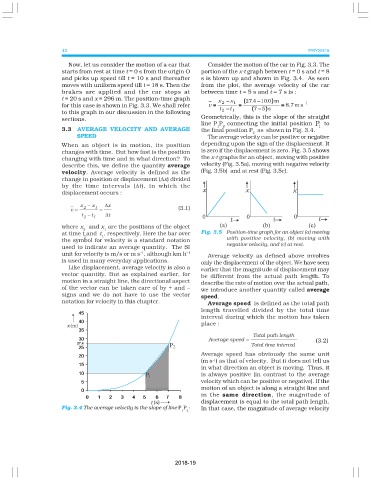
Now, let us consider the motion of a car that Consider the motion of the car in Fig. 3.3. The
starts from rest at time t = 0 s from the origin O portion of the x-t graph between t = 0 s and t = 8
and picks up speed till t = 10 s and thereafter s is blown up and shown in Fig. 3.4. As seen
moves with uniform speed till t = 18 s. Then the from the plot, the average velocity of the car
brakes are applied and the car stops at between time t = 5 s and t = 7 s is :
t = 20 s and x = 296 m. The position-time graph x 2 −− − x 1 ( (( (27. 4 − −− − 10. 0 ) )) ) m
−
for this case is shown in Fig. 3.3. We shall refer v = = = = = = = = = = = = 8.7 m s – 1
−
t 2 −− − t 1 ( (( (7 − −− − 5 ) )) ) s
to this graph in our discussion in the following
sections. Geometrically, this is the slope of the straight
line P P 2 connecting the initial position P 1 to
1
3.3 AVERAGE VELOCITY AND AVERAGE the final position P as shown in Fig. 3.4.
2
SPEED The average velocity can be positive or negative
When an object is in motion, its position depending upon the sign of the displacement. It
changes with time. But how fast is the position is zero if the displacement is zero. Fig. 3.5 shows
changing with time and in what direction? To the x-t graphs for an object, moving with positive
describe this, we define the quantity average velocity (Fig. 3.5a), moving with negative velocity
velocity. Average velocity is defined as the (Fig. 3.5b) and at rest (Fig. 3.5c).
change in position or displacement (∆x) divided
by the time intervals (∆t), in which the
displacement occurs :
x − x ∆ x
v = 2 1 = (3.1)
t − t t ∆
2 1
where x and x are the positions of the object
2 1
at time t and t , respectively. Here the bar over Fig. 3.5 Position-time graph for an object (a) moving
2 1 with positive velocity, (b) moving with
the symbol for velocity is a standard notation
used to indicate an average quantity. The SI negative velocity, and (c) at rest.
–1
unit for velocity is m/s or m s , although km h –1 Average velocity as defined above involves
is used in many everyday applications. only the displacement of the object. We have seen
Like displacement, average velocity is also a earlier that the magnitude of displacement may
vector quantity. But as explained earlier, for be different from the actual path length. To
motion in a straight line, the directional aspect describe the rate of motion over the actual path,
of the vector can be taken care of by + and – we introduce another quantity called average
signs and we do not have to use the vector speed.
notation for velocity in this chapter. Average speed is defined as the total path
length travelled divided by the total time
interval during which the motion has taken
place :
Total path length
Average speed = (3.2)
Total time interval
Average speed has obviously the same unit
(m s ) as that of velocity. But it does not tell us
–1
in what direction an object is moving. Thus, it
is always positive (in contrast to the average
velocity which can be positive or negative). If the
motion of an object is along a straight line and
in the same direction, the magnitude of
displacement is equal to the total path length.
Fig. 3.4 The average velocity is the slope of line P P . In that case, the magnitude of average velocity
1 2
2018-19