Page 35 - The Atlas of Economic Complexity
P. 35

36  |  THE ATLAS OF ECONOMIC COMPLEXITY
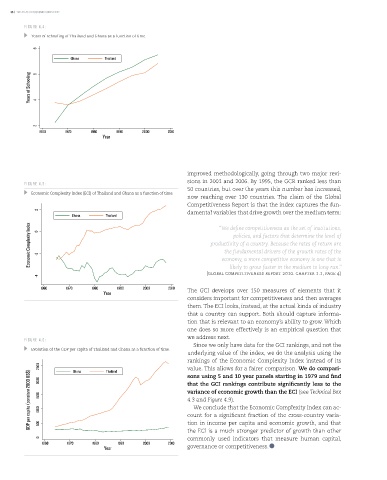

          FIGURE 4.4:
             Years of schooling of Thailand and Ghana as a function of time.

               8
                           Ghana        Thailand


            Years of Schooling  6  4


               2
                1960     1970      1980     1990      2000      2010
                                       Year


                                                                       improved methodologically, going through two major revi-
                                                                       sions in 2001 and 2006. By 1995, the GCR ranked less than
          FIGURE 4.5:
                                                                       50 countries, but over the years this number has increased,
             Economic Complexity Index (ECI) of Thailand and Ghana as a function of time.
                                                                       now  reaching  over  130  countries. The  claim  of  the  Global
                                                                       Competitiveness Report is that the index captures the fun-
               2                                                       damental variables that drive growth over the medium term:
                            Ghana       Thailand                                   “We define competitiveness as the set of institutions,
            Economic Complexity Index  0  -2                                   productivity of a country. Because the rates of return are
                                                                                        policies, and factors that determine the level of


                                                                                     the fundamental drivers of the growth rates of the
                                                                                    economy, a more competitive economy is one that is
                                                                                       likely to grow faster in the medium to long run.”
                                                                              (global competitiveness report 2010. chapter 1.1, page 4)
               -4
                1960      1970     1980      1990     2000      2010   The  GCI  develops  over  150  measures  of  elements  that  it
                                        Year
                                                                       considers important for competitiveness and then averages
                                                                       them. The ECI looks, instead, at the actual kinds of industry
                                                                       that a country can support. Both should capture informa-
                                                                       tion that is relevant to an economy’s ability to grow. Which
                                                                       one does so more effectively is an empirical question that
                                                                       we address next.
          FIGURE 4.6:
                                                                         Since we only have data for the GCI rankings, and not the
             Evolution of the GDP per capita of Thailand and Ghana as a function of time.
                                                                       underlying value of the index, we do the analysis using the
                                                                       rankings of the Economic Complexity Index instead of its
                2500  2000  Ghana        Thailand                      value. This allows for a fairer comparison. We do compari-
            GDP per capita (constant 2000 US$)  1500  1000             that the GCI rankings contribute significantly less to the
                                                                       sons using 5 and 10 year panels starting in 1979 and find

                                                                       variance of economic growth than the ECI (see Technical Box
                                                                       4.3 and Figure 4.9).
                                                                         We conclude that the Economic Complexity Index can ac-
                                                                       count for a significant fraction of the cross-country varia-

                                                                       the ECI is a much stronger predictor of growth than other
                                                                       commonly  used  indicators  that  measure  human  capital,
                0  500                                                 tion in income per capita and economic growth, and that
                 1960     1970     1980      1990     2000      2010   governance or competitiveness.
                                        Year
   30   31   32   33   34   35   36   37   38   39   40