
Page 36 - The Atlas of Economic Complexity
P. 36
MAPPING PATHS TO PROSPERITY | 37
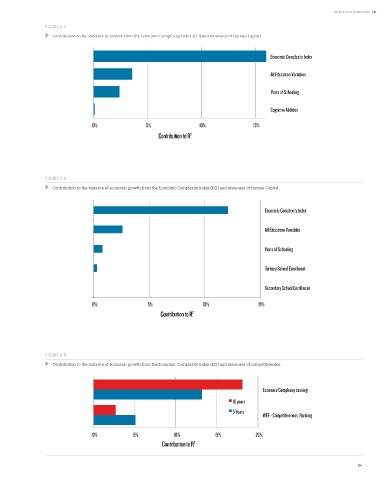
FIGURE 4.7:
Contribution to the variance of income from the Economic Complexity Index (ECI) and measures of Human Capital.
Economic Complexity Index
All Education Variables
Years of Schooling
Cognitive Abilities
0% 5% 10% 15%
Contribution to R 2
FIGURE 4.8:
Contribution to the variance of economic growth from the Economic Complexity Index (ECI) and measures of Human Capital.
Economic Complexity Index
All Education Variables
Years of Schooling
Tertiary School Enrollment
Secondary School Enrollment
0% 5% 10% 15%
Contribution to R 2
FIGURE 4.9:
Contribution to the variance of economic growth from the Economic Complexity Index (ECI) and measures of competitiveness.
Economic Complexity ranking
10 years
5 Years
WEF - Competitiveness Ranking
0% 5% 10% 15% 20%
Contribution to R 2