
Page 38 - The Atlas of Economic Complexity
P. 38
MAPPING PATHS TO PROSPERITY | 39
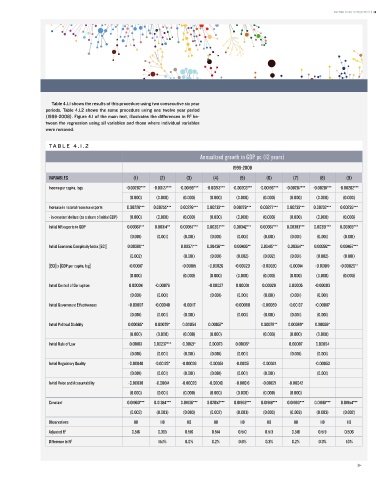
table 4.1.1 shows the results of this procedure using two consecutive six year
periods. table 4.1.2 shows the same procedure using one twelve year period
(1996-2008). Figure 4.1 of the main text, illustrates the differences in r be-
2
tween the regression using all variables and those where individual variables
were removed.
TA B L E 4 . 1 . 2
Annualized growth in GDP pc (12 years)
1996-2008
VARIABLES (1) (2) (3) (4) (5) (6) (7) (8) (9)
Income per capita, logs -0.00202*** -0.00127*** -0.00199*** -0.00213*** -0.00203*** -0.00196*** -0.00207*** -0.00201*** -0.00202***
(0.000) (0.000) (0.000) (0.000) (0.000) (0.000) (0.000) (0.000) (0.000)
Increase in natural resource exports 0.00228*** 0.00255*** 0.00226*** 0.00233*** 0.00228*** 0.00227*** 0.00233*** 0.00232*** 0.00235***
- in constant dollars (as a share of initial GDP) (0.000) (0.000) (0.000) (0.000) (0.000) (0.000) (0.000) (0.000) (0.000)
Initial NR exports to GDP 0.00361*** 0.00314** 0.00357*** 0.00367*** 0.00342*** 0.00367*** 0.00383*** 0.00361*** 0.00369***
(0.001) (0.001) (0.001) (0.001) (0.001) (0.001) (0.001) (0.001) (0.001)
Initial Economic Complexity Index [ECI] 0.00380** 0.00371*** 0.00436*** 0.00405** 0.00415*** 0.00364** 0.00392** 0.00467***
(0.002) (0.001) (0.001) (0.002) (0.002) (0.001) (0.002) (0.001)
[ECI] x [GDP per capita, log] -0.00017 -0.00015 -0.00026 -0.00020 -0.00020 -0.00014 -0.00019 -0.00026**
(0.000) (0.000) (0.000) (0.000) (0.000) (0.000) (0.000) (0.000)
Initial Control of Corruption 0.00004 -0.00079 -0.00027 0.00001 0.00029 0.00005 -0.00003
(0.001) (0.001) (0.001) (0.001) (0.001) (0.001) (0.001)
Initial Government Effectiveness -0.00097 -0.00040 -0.00117 -0.00080 -0.00069 -0.00107 -0.00087
(0.001) (0.001) (0.001) (0.001) (0.001) (0.001) (0.001)
Initial Political Stability 0.00065* 0.00079* 0.00054 0.00057* 0.00078** 0.00069* 0.00059*
(0.000) (0.000) (0.000) (0.000) (0.000) (0.000) (0.000)
Initial Rule of Law 0.00103 0.00237*** 0.00121* 0.00073 0.00135* 0.00087 0.00094
(0.001) (0.001) (0.001) (0.001) (0.001) (0.001) (0.001)
Initial Regulatory Quality -0.00040 -0.00125* -0.00036 -0.00051 -0.00051 -0.00024 -0.00053
(0.001) (0.001) (0.001) (0.001) (0.001) (0.001) (0.001)
Initial Voice and Accountability -0.00030 -0.00014 -0.00028 -0.00019 -0.00016 -0.00021 -0.00042
(0.000) (0.001) (0.000) (0.000) (0.000) (0.000) (0.000)
Constant 0.01960*** 0.01384*** 0.01936*** 0.02052*** 0.01963*** 0.01918*** 0.01993*** 0.01961*** 0.01954***
(0.003) (0.003) (0.003) (0.002) (0.003) (0.003) (0.003) (0.003) (0.002)
Observations 118 118 118 118 118 118 118 118 118
Adjusted R 2 0.516 0.365 0.516 0.514 0.510 0.513 0.518 0.519 0.506
Difference in R 2 15.1% 0.0% 0.2% 0.6% 0.3% 0.2% 0.3% 1.0%