
Page 37 - The Atlas of Economic Complexity
P. 37
38 | THE ATLAS OF ECONOMIC COMPLEXITY
t e c h n I c a l B o x 4 . 1 : g o v e r n a n c e a n d c o m p l e x I t y
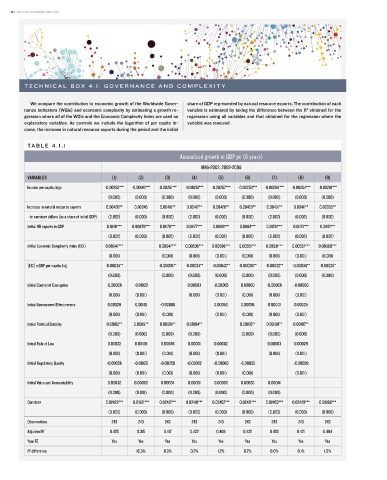
We compare the contribution to economic growth of the Worldwide gover- share of gDp represented by natural resource exports. the contribution of each
2
nance indicators (Wgis) and economic complexity by estimating a growth re- variable is estimated by taking the difference between the r obtained for the
gression where all of the Wgis and the economic Complexity index are used as regression using all variables and that obtained for the regression where the
explanatory variables. as controls we include the logarithm of per capita in- variable was removed.
come, the increase in natural resource exports during the period and the initial
TA B L E 4 . 1 . 1
Annualized growth in GDP pc (6 years)
1996-2002, 2002-2008
VARIABLES (1) (2) (3) (4) (5) (6) (7) (8) (9)
Income per capita, logs -0.00253*** -0.00149*** -0.00251*** -0.00251*** -0.00257*** -0.00253*** -0.00258*** -0.00254*** -0.00210***
(0.000) (0.000) (0.000) (0.000) (0.000) (0.000) (0.000) (0.000) (0.000)
Increase in natural resource exports 0.00420** 0.00246 0.00418** 0.00417** 0.00426** 0.00423** 0.00431** 0.00411** 0.00393**
- in constant dollars (as a share of initial GDP) (0.002) (0.003) (0.002) (0.002) (0.002) (0.002) (0.002) (0.002) (0.002)
Initial NR exports to GDP 0.01181*** 0.00879*** 0.01178*** 0.01177*** 0.01169*** 0.01184*** 0.01214*** 0.01174*** 0.01121***
(0.002) (0.003) (0.002) (0.002) (0.002) (0.002) (0.002) (0.002) (0.002)
Initial Economic Complexity Index (ECI) 0.00547*** 0.00547*** 0.00536*** 0.00598*** 0.00551*** 0.00531*** 0.00537*** 0.00500***
(0.001) (0.001) (0.001) (0.001) (0.001) (0.001) (0.001) (0.001)
[ECI] x GDP per capita, log -0.00035** -0.00035** -0.00034** -0.00042** -0.00036** -0.00032** -0.00034** -0.00026*
(0.000) (0.000) (0.000) (0.000) (0.000) (0.000) (0.000) (0.000)
Initial Control of Corruption -0.00006 -0.00123 0.00003 -0.00005 0.00000 -0.00006 -0.00006
(0.001) (0.001) (0.001) (0.001) (0.001) (0.001) (0.001)
Initial Government Effectiveness 0.00029 0.00110 -0.00006 0.00050 0.00036 0.00013 0.00025
(0.001) (0.001) (0.001) (0.001) (0.001) (0.001) (0.001)
Initial Political Stability 0.00102** 0.00119** 0.00091** 0.00104** 0.00105** 0.00106** 0.00107**
(0.000) (0.000) (0.000) (0.000) (0.000) (0.000) (0.000)
Initial Rule of Law 0.00022 0.00105 0.00046 0.00031 0.00082 0.00003 0.00029
(0.001) (0.001) (0.001) (0.001) (0.001) (0.001) (0.001)
Initial Regulatory Quality -0.00056 -0.00125 -0.00050 -0.00052 -0.00068 -0.00053 -0.00039
(0.001) (0.001) (0.001) (0.001) (0.001) (0.001) (0.001)
Initial Voice and Accountability 0.00032 0.00053 0.00034 0.00031 0.00050 0.00033 0.00014
(0.000) (0.001) (0.000) (0.000) (0.000) (0.000) (0.000)
Constant 0.02428*** 0.01621*** 0.02412*** 0.02410*** 0.02452*** 0.02421*** 0.02453*** 0.02429*** 0.01868***
(0.003) (0.003) (0.003) (0.003) (0.003) (0.003) (0.003) (0.003) (0.002)
Observations 243 243 243 243 243 243 243 243 243
Adjusted R 2 0.420 0.315 0.417 0.422 0.408 0.422 0.420 0.421 0.404
Year FE Yes Yes Yes Yes Yes Yes Yes Yes Yes
2
R difference 10.5% 0.3% 0.2% 1.2% 0.2% 0.0% 0.1% 1.6%