
Page 150 - Robot Design Handbook ROBOCON Malaysia 2019
P. 150
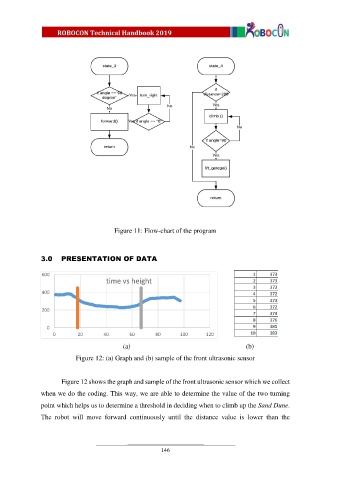
Figure 11: Flow-chart of the program


               3.0    PRESENTATION OF DATA


                600
                                      time vs height

                400


                200

                  0
                    0       20       40        60       80      100      120
                                            (a)                                        (b)

                            Figure 12: (a) Graph and (b) sample of the front ultrasonic sensor


                       Figure 12 shows the graph and sample of the front ultrasonic sensor which we collect
               when we do the coding. This way, we are able to determine the value of the two turning

               point which helps us to determine a threshold in deciding when to climb up the Sand Dune.

               The  robot  will  move  forward  continuously  until  the  distance  value  is  lower  than  the


                                                          146