
Page 53 - MODULE QUALITY TOOLS DMQ 30262
P. 53
DMQ 30262
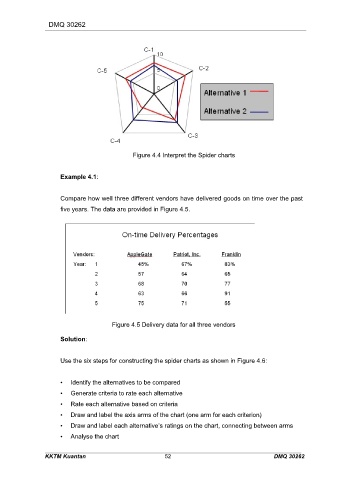
Figure 4.4 Interpret the Spider charts
Example 4.1:
Compare how well three different vendors have delivered goods on time over the past
five years. The data are provided in Figure 4.5.
Figure 4.5 Delivery data for all three vendors
Solution:
Use the six steps for constructing the spider charts as shown in Figure 4.6:
• Identify the alternatives to be compared
• Generate criteria to rate each alternative
• Rate each alternative based on criteria
• Draw and label the axis arms of the chart (one arm for each criterion)
• Draw and label each alternative’s ratings on the chart, connecting between arms
• Analyse the chart
KKTM Kuantan 52 DMQ 30262