
Page 21 - analysis-and-interpretation-of-astronomical-sp
P. 21
Analysis and Interpretation of Astronomical Spectra 21
7 The Measurement of the Spectral Lines
7.1 Methods and Reference Values of the Intensity Measurement
Depending on the specific task, the line intensity is determined either by simple relative
measurement, or quite complexly and time consuming, with absolutely calibrated dimen-
sions. Here we focus exclusively on the relative measurement which is sufficient for most
amateur purposes, and is supported by the analysis software (eg Vspec). As a reference or
unit usually serves the local or normalised continuum level (sect. 8) but possibly also val-
ues of a linear, but otherwise arbitrary scaling of the intensity axis.
7.2 Metrological Differences between Absorption and Emission Lines
For measurements of spectral lines the following differences must be noted.
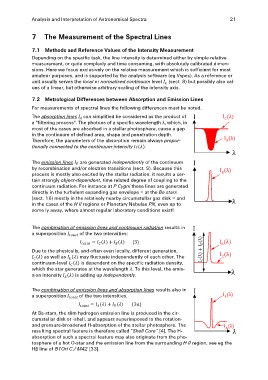
The absorption lines can simplified be considered as the product of I IC λ)
a "filtering process". The photons of a specific wavelength λ, which, in IA λ)
most of the cases are absorbed in a stellar photosphere, cause a gap
in the continuum of defined area, shape and penetration depth. λ
Therefore, the parameters of the absorption remain always propor-
tionally connected to the continuum-intensity . IE λ)
The emission lines are generated independently of the continuum I λ
by recombination and/or electron transitions (sect. 9). Because this
process is mostly also excited by the stellar radiation, it results a cer-
tain strongly object-dependent, time related degree of coupling to the
continuum radiation. For instance at P Cygni these lines are generated
directly in the turbulent expanding gas envelope – at the Be stars
(sect. 16) mostly in the relatively nearby circumstellar gas disk – and
in the cases of the H II regions or Planetary Nebulae PN, even up to
some ly away, where almost regular laboratory conditions exist!
The combination of emission lines and continuum radiation results in I
a superposition of the two intensities: IC λ) + IE λ)
Due to the physically, and often even locally, different generation, IE λ)
as well as may fluctuate independently of each other. The IC λ)
continuum-level is dependent on the specific radiation density, λ
which the star generates at the wavelength . To this level, the emis- IE λ
sion intensity is adding up independently.
The combination of emission lines and absorption lines results also in I
a superposition of the two intensities.
At Be-stars, the slim hydrogen emission line is produced in the cir-
cumstellar disk or -shell, and appears superimposed to the rotation-
and pressure-broadened H-absorption of the stellar photosphere. The
resulting spectral feature is therefore called “Shell Core” [4]. The H- IA λ
absorption of such a spectral feature may also originate from the pho-
λ
tosphere of a hot O-star and the emission line from the surrounding H II region, see eg the
Hβ line of Θ1Ori C / M42 [33].