
Page 19 - analysis-and-interpretation-of-astronomical-sp
P. 19
Analysis and Interpretation of Astronomical Spectra 19
6 Form and Intensity of the Spectral Lines
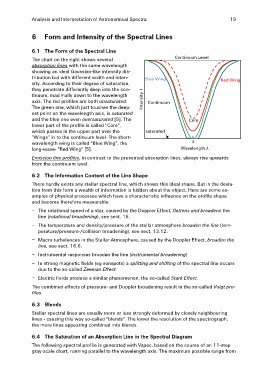
6.1 The Form of the Spectral Line Continuum Level Red Wing
Blue Wing
The chart on the right shows several
absorption lines with the same wavelength, Intensity I Continuum
showing an ideal Gaussian-like intensity dis-
tribution but with different width and inten- saturated Core
sity. According to their degree of saturation,
they penetrate differently deep into the con- λ
tinuum, maximally down to the wavelength Wavelength λ
axis. The red profiles are both unsaturated.
The green one, which just touches the deep-
est point on the wavelength axis, is saturated
and the blue one even oversaturated [5]. The
lower part of the profile is called "Core",
which passes in the upper part over the
"Wings" in to the continuum level. The short-
wavelength wing is called "Blue Wing", the
long-wave- "Red Wing" [5].
Emission line profiles, in contrast to the presented absorption lines, always rise upwards
from the continuum level.
6.2 The Information Content of the Line Shape
There hardly exists any stellar spectral line, which shows this ideal shape. But in the devia-
tion from this form a wealth of information is hidden about the object. Here are some ex-
amples of physical processes which have a characteristic influence on the profile shape
and become therefore measurable:
– The rotational speed of a star, caused by the Doppler Effect, flattens and broadens the
line (rotational broadening), see sect. 16.
– The temperature and density/pressure of the stellar atmosphere broaden the line (tem-
perature/pressure-/collision broadening), see sect. 13.12.
– Macro turbulences in the Stellar Atmosphere, caused by the Doppler Effect, broaden the
line, see sect. 16.6.
– Instrumental responses broaden the line (instrumental broadening)
– In strong magnetic fields (eg sunspots) a splitting and shifting of the spectral line occurs
due to the so-called Zeeman Effect.
– Electric fields produce a similar phenomenon, the so-called Stark Effect.
The combined effects of pressure- and Doppler broadening result in the so-called Voigt pro-
files.
6.3 Blends
Stellar spectral lines are usually more or less strongly deformed by closely neighbouring
lines - causing this way so-called "blends". The lower the resolution of the spectrograph,
the more lines appearing combined into blends.
6.4 The Saturation of an Absorption Line in the Spectral Diagram
The following spectral profile is generated with Vspec, based on the course of an 11-step
gray-scale chart, running parallel to the wavelength axis. The maximum possible range from