
Page 20 - analysis-and-interpretation-of-astronomical-sp
P. 20
Analysis and Interpretation of Astronomical Spectra 20
black to white, covered by Vspec, comprises 256 gray levels [411]. The Profile section in
the black area is here, as expected, saturated to 100% and runs therefore on the lowest
level, ie congruent with the wavelength axis. The saturation of the remaining gray values
decreases staircase-like upward, until on the continuum level, it finally becomes white. If an
underexposed spectral stripe was prepared in advance with IRIS [410] [30], the gray scale
is stretched, so that the highest point on the chart becomes white. Thus, a maximum con-
trast is achieved.
Continuum Level = white
saturated = black
Gray-values
Gray-scale chart
Wavelength axis = black
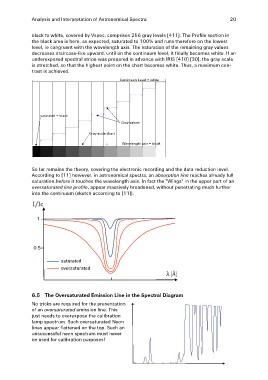
So far remains the theory, covering the electronic recording and the data reduction level.
According to [11] however, in astronomical spectra, an absorption line reaches already full
saturation before it touches the wavelength axis. In fact the "Wings" in the upper part of an
oversaturated line profile, appear massively broadened, without penetrating much further
into the continuum (sketch according to [11]).
I/Ic
saturated
oversaturated
λ [Å]
6.5 The Oversaturated Emission Line in the Spectral Diagram
No tricks are required for the presentation
of an oversaturated emission line. This
just needs to overexpose the calibration
lamp spectrum. Such oversaturated Neon
lines appear flattened on the top. Such an
unsuccessful neon spectrum must never
be used for calibration purposes!