
Page 148 - spectroscopic-atlas-5_0-english_Neat
P. 148
Spectroscopic Atlas for Amateur Astronomers 148
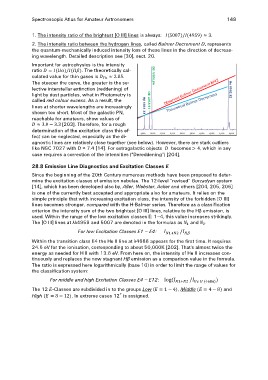
1. The intensity ratio of the brightest [O III] lines is always: (ܫ5007)/(ܫ4959) ≈ 3.Olll 5006.84Hα 6562.82
2. The intensity ratio between the hydrogen lines, called Balmer Decrement D, representsOlll 4958.91
the quantum-mechanically induced intensity loss of these lines in the direction of decreas-Hβ 4861.33
ing wavelength. Detailed description see [30], sect. 20.
Important for astrophysics is the intensity
ratio )ߙܪ(ܫ = ܦ/)ߚܪ(ܫ. The theoretically cal-
culated value for thin gases is ்ܦ ≈ 2.85.
The steeper the curve, the greater is the se-
lective interstellar extinction (reddening) of
light by dust particles, what in Photometry is
called red colour excess. As a result, the
lines at shorter wavelengths are increasingly
shown too short. Most of the galactic PN,
reachable for amateurs, show values of
≈ ܦ3.0 − 3.3 [203]. Therefore, for a rough
determination of the excitation class this ef-
fect can be neglected, especially as the di-
agnostic lines are relatively close together (see below). However, there are stark outliers
like NGC 7027 with D ≈ 7.4 [14]. For extragalactic objects ܦbecomes > 4, which in any
case requires a correction of the intensities ("Dereddening") [204].
28.8 Emission Line Diagnostics and Excitation Classes ࡱ
Since the beginning of the 20th Century numerous methods have been proposed to deter-
mine the excitation classes of emission nebulae. The 12-level “revised” Gurzadyan system
[14], which has been developed also by, Aller, Webster, Acker and others [204, 205, 206]
is one of the currently best accepted and appropriate also for amateurs. It relies on the
simple principle that with increasing excitation class, the intensity of the forbidden [O III]
lines becomes stronger, compared with the H-Balmer series. Therefore as a classification
criterion the intensity sum of the two brightest [O III] lines, relative to the Hβ emission, is
used. Within the range of the low excitation classes E: 1–4, this value increases strikingly.
The [O III] lines at λλ4959 and 5007 are denoted in the formulas as ܰଵ and ܰଶ.
For low Excitation Classes E1 – E4: ܫேଵାேଶ /ܫுఉ
Within the transition class E4 the He II line at λ4686 appears for the first time. It requires
24.6 eV for the ionisation, corresponding to about 50,000K [202]. That's almost twice the
energy as needed for H II with 13.6 eV. From here on, the intensity of He II increases con-
tinuously and replaces the now stagnant Hβ emission as a comparison value in the formula.
The ratio is expressed here logarithmically (base 10) in order to limit the range of values for
the classification system:
For middle and high Excitation Classes E4 – E12: log(ܫேଵାேଶ /ܫு ூூ (ସ଼))
The 12 ܧ-Classes are subdivided in to the groups Low ( = ܧ1 − 4), Middle ( = ܧ4 − 8) and
High ( = ܧ8 − 12). In extreme cases 12+ is assigned.