
Page 151 - spectroscopic-atlas-5_0-english_Neat
P. 151
Spectroscopic Atlas for Amateur Astronomers 151
By pushing off the envelope and the progressive “exposing” of increasingly hotter, inner
stellar layers, central stars of PN may generate spectra, simulating substantially more mas-
sive and luminous stars. This applies, for example, for all O-, early B- and WR-
classifications! However the progenitor stars of planetary nebulae are limited to maximum
8 solar masses, corresponding to the middle B class.
Table 80 Orion Nebula M42, NGC1976 Object type: HII region Excitation class: E1
T80 shows the emission spectrum of M42 (approx. 1400 ly) taken in the immediate vicinity
of the trapezium θ1 Orionis. Main radiation source is the C- component, a blue giant of the
rare, early spectral type O6 (see Table 3) with a temperature of approx. 40,000K [207]. To-
gether with the other stars of the early B-Class, it is capable to excite the surrounding neb-
ula with the criterion value ܫேଵାேଶ /ܫுఉ ≈ 5 up to the border area between the classes E1
and E2. The Hβ line is here just slightly surpassed by the [O III] (λ 4959) emission. Due to
the enormous apparent brightness the object is spectrographically easy accessible and re-
quires only modest exposure times. (10x30 seconds).
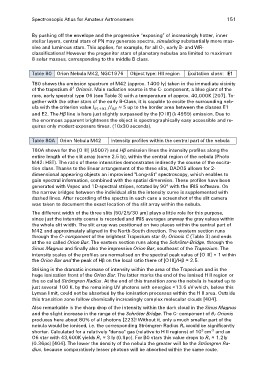
Table 80A Orion Nebula M42 Intensity profiles within the central part of the nebula
T80A shows for the [O III] (λ5007) and Hβ emission lines the intensity profiles along the
entire length of the slit array (some 2.5 ly), within the central region of the nebula (Photo
M42: HST). The ratio of these intensities demonstrates indirectly the course of the excita-
tion class. Thanks to the linear arrangement of the three slits, DADOS allows for 2-
dimensional appearing objects an improvised "Long-slit" spectroscopy, which enables to
gain spectral information, combined with the spatial dimension. These profiles have been
generated with Vspec and 1D-spectral stripes, rotated by 90° with the IRIS software. On
the narrow bridges between the individual slits the intensity curve is supplemented with
dashed lines. After recording of the spectra in each case a screenshot of the slit camera
was taken to document the exact location of the slit array within the nebula.
The different width of the three slits (50/25/30 μm) plays a little role for this purpose,
since just the intensity course is recorded and IRIS averages anyway the gray values within
the whole slit width. The slit array was positioned on two places within the central part of
M42 and approximately aligned in the North-South direction. The western section runs
through the C- component of the brightest Trapezium star Θ1 Orionis C (Table 3) and ends
at the so called Orion Bar. The eastern section runs along the Schröter-Bridge, through the
Sinus Magnus and finally also the impressive Orion Bar, southeast of the Trapezium. The
intensity scales of the profiles are normalised on the spectral peak value of [O III] = 1 within
the Orion Bar and the peak of Hβ on the local ratio there of [O III]/Hβ ≈ 2.5.
Striking is the dramatic increase of intensity within the area of the Trapezium and in the
huge ionisation front of the Orion Bar. The latter marks the end of the ionised H II region or
the so called Strömgren Radius. At the end of this transition zone the nebula is heated up to
just several 100 K, by the remaining UV photons with energies <13.6 eV which, below this
Lyman limit, could not be absorbed by the ionisation processes within the H II area. Outside
this transition zone follow chemically increasingly complex molecular clouds [404].
Also remarkable is the sharp drop of the intensity within the dark cloud in the Sinus Magnus
and the slight increase in the range of the Schröter Bridge. The C- component of θ1 Orionis
produces here about 80% of all photons [223]! Without it, only a much smaller part of the
nebula would be ionised, i.e. the corresponding Strömgren Radius Rs would be significantly
shorter. Calculated for a relatively "dense" gas (relative to H II regions) of 103 cm-3 and an
O6 star with 43,600K yields Rs ≈ 3 ly (0.9pc). For B0 stars this value drops to Rs ≈ 1.2ly
(0.36pc) [404]. The lower the density of the nebula the greater will be the Strömgren Ra-
dius, because comparatively lesser photons will be absorbed within the same route.