
Page 149 - spectroscopic-atlas-5_0-english_Neat
P. 149
Spectroscopic Atlas for Amateur Astronomers 149
Low Middle High
–ܧClass –ܧClass log(ܫேଵାேଶ /ܫସ଼)
ܫேଵାேଶ /ܫுఉ –ܧClass log(ܫேଵାேଶ /ܫସ଼)
E1 0–5 E4 2.6 E9 1.7
E2 5 – 10 E5 2.5
E3 E6 2.3 E10 1.5
E4 10 – 15 E7 2.1 E11 1.2
>15 E8 1.9
E12 0.9
E12+ 0.6
28.9 Remarks to the Determination of Excitation Classes and Recording of Spectra
The determination of the low E classes 1–4 is easy, since the Hβ line, compared to the
[O III] emission, is relatively intense. At level E4 the He II line (λ 4686) starts very weak, re-
quiring very low-noise spectra, and a strong zoom into the intensity axis.
Quite easy to record are spectra from the very small, disc-shaped and blue-greenish shining
PN. Thus they are very quickly to localize within a stellar group and the exposure time for
the bright representatives takes only a few minutes (200L reflection grating). The brightest
[O III] line appears often just after a few seconds on the screen (eg NGC 6210). The inten-
sity of the lines is here integrated along the very short, exposed part of the slit. But along
this very short appearing diameter the individual lines show considera-
bly different intensities. Furthermore, during long exposure times, small
changes in the slit position with respect to the nebula are to observe as
a result of inadequate seeing and/or guiding quality. Tests have shown
that several spectra of the same object may show significantly different
results including for the Balmer Decrement. Anyway the influence on
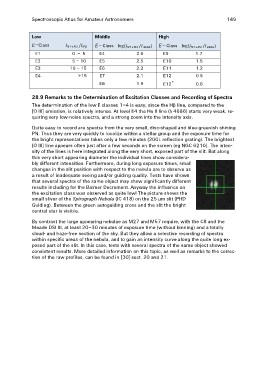
the excitation class was observed as quite low! The picture shows the
small sliver of the Spirograph Nebula (IC 418) on the 25 μm slit (PHD
Guiding). Between the green autoguiding cross and the slit the bright
central star is visible.
By contrast the large appearing nebulae as M27 and M57 require, with the C8 and the
Meade DSI III, at least 20–30 minutes of exposure time (without binning) and a totally
cloud- and haze-free section of the sky. But they allow a selective recording of spectra
within specific areas of the nebula, and to gain an intensity curve along the quite long ex-
posed part of the slit. In this case, tests with several spectra of the same object showed
consistent results. More detailed information on this topic, as well as remarks to the correc-
tion of the raw profiles, can be found in [30] sect. 20 and 21.