
Page 154 - spectroscopic-atlas-5_0-english_Neat
P. 154
Spectroscopic Atlas for Amateur Astronomers 154
passable rural sky with a visible magnitude of maximum about 4–5m. This disturbing spec-
trum was therefore recorded separately, just outside the nebula, and afterwards subtracted
with Fitswork from the M1 signal.
This apparently almost 1,000 years old expanding shell is meanwhile diluted to such an ex-
tent, that it has become optically transparent. This show also the redshifted peaks of the
split, well shaped emission lines, often appearing of similar intensity like the blue-shifted,
but in some cases however significantly weaker.
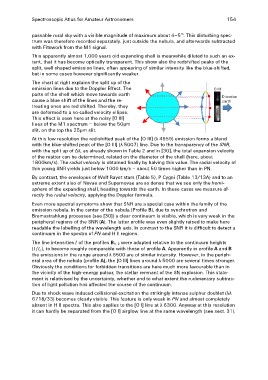
The chart at right explains the split up of the O III
emission lines due to the Doppler Effect. The
parts of the shell which move towards earth Direction
cause a blue shift of the lines and the re- earth
treating ones are red shifted. Thereby, they
are deformed to a so-called velocity ellipse.
This effect is seen here at the noisy [O III]
lines of the M1 spectrum – below the 50μm
slit, on the top the 25μm slit.
At this low resolution the red-shifted peak of the [O III] (λ 4959) emission forms a blend
with the blue-shifted peak of the [O III] (λ 5007) line. Due to the transparency of the SNR,
with the split up of Δλ, as already shown in Table 2 and in [30], the total expansion velocity
of the matter can be determined, related on the diameter of the shell (here, about
1800km/s). The radial velocity is obtained finally by halving this value. The radial velocity of
this young SNR yields just below 1000 km/s – about 50 times higher than in PN.
By contrast, the envelopes of Wolf Rayet stars (Table 5), P Cygni (Table 13/13A) and to an
extreme extent also of Novae and Supernovae are so dense that we see only the hemi-
sphere of the expanding shell, heading towards the earth. In these cases we measure di-
rectly the radial velocity, applying the Doppler formula.
Even more spectral symptoms show that SNR are a special case within the family of the
emission nebula. In the center of the nebula (Profile B), due to synchrotron and
Bremsstrahlung processes (see [30]) a clear continuum is visible, which is very weak in the
peripheral regions of the SNR (A). The latter profile was even slightly raised to make here
readable the labelling of the wavelength axis. In contrast to the SNR it is difficult to detect a
continuum in the spectra of PN and H II regions.
The line intensities ܫof the profiles B1, 2 were adapted relative to the continuum heights
(ܫ/ܫ), to become roughly comparable with those of profile A. Apparently in profile A and B
the emissions in the range around λ 6500 are of similar intensity. However, in the periph-
eral area of the nebula (profile A), the [O III] lines around λ 5000 are several times stronger.
Obviously the conditions for forbidden transitions are here much more favourable than in
the vicinity of the high-energy pulsar, the stellar remnant of the SN explosion. This state-
ment is relativised by the uncertainty, whether and to what extent the rudimentary subtrac-
tion of light pollution has affected the course of the continuum.
Due to shock wave induced collisional-excitation the strikingly intense sulphur doublet (λλ
6718/33) becomes clearly visible. This feature is only weak in PN and almost completely
absent in H II spectra. This also applies to the [O I] line at λ 6300. Anyway at this resolution
it can hardly be separated from the [O I] airglow line at the same wavelength (see sect. 31).