
Page 16 - กลุ่ม 6 ทำอีบุ๊ค
P. 16
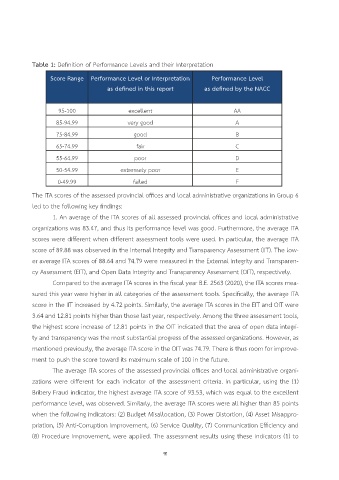
Table 1: Definition of Performance Levels and their Interpretation

                   Score Range Performance Level or Interpretation         Performance Level
                                       as defined in this report         as defined by the NACC


                      95-100                  excellent                            AA

                     85-94.99                 very good                             A
                     75-84.99                   good                                B

                     65-74.99                    fair                               C

                     55-64.99                   poor                                D
                     50-54.99              extremely poor                           E

                     0-49.99                    failed                              F

            The ITA scores of the assessed provincial offices and local administrative organizations in Group 6
            led to the following key findings:
                    1. An average of the ITA scores of all assessed provincial offices and local administrative

            organizations was 83.47, and thus its performance level was good. Furthermore, the average ITA
            scores were different when different assessment tools were used. In particular, the average ITA

            score of 89.88 was observed in the Internal Integrity and Transparency Assessment (IIT). The low-
            er average ITA scores of 88.64 and 74.79 were measured in the External Integrity and Transparen-
            cy Assessment (EIT), and Open Data Integrity and Transparency Assessment (OIT), respectively.

                    Compared to the average ITA scores in the fiscal year B.E. 2563 (2020), the ITA scores mea-
            sured this year were higher in all categories of the assessment tools. Specifically, the average ITA

            score in the IIT increased by 4.72 points. Similarly, the average ITA scores in the EIT and OIT were
            3.64 and 12.81 points higher than those last year, respectively. Among the three assessment tools,
            the highest score increase of 12.81 points in the OIT indicated that the area of open data integri-

            ty and transparency was the most substantial progress of the assessed organizations. However, as
            mentioned previously, the average ITA score in the OIT was 74.79. There is thus room for improve-

            ment to push the score toward its maximum scale of 100 in the future.
                    The average ITA scores of the assessed provincial offices and local administrative organi-
            zations were different for each indicator of the assessment criteria. In particular, using the (1)

            Bribery Fraud indicator, the highest average ITA score of 93.53, which was equal to the excellent
            performance level, was observed. Similarly, the average ITA scores were all higher than 85 points

            when the following indicators: (2) Budget Misallocation, (3) Power Distortion, (4) Asset Misappro-
            priation, (5) Anti-Corruption Improvement, (6) Service Quality, (7) Communication Efficiency and
            (8) Procedure Improvement, were applied. The assessment results using these indicators (1) to


                                                          ฑ