
Page 18 - กลุ่ม 6 ทำอีบุ๊ค
P. 18
3.3 In the municipality category, the top two scores of 93.08 and 90.02 were found
in the indicators (1) Bribery Fraud and (3) Power Distortion, respectively. In contrast, the lowest
average ITA score of 66.12 was observed in the indicator (10) Anti-Corruption Practice.
3.4 In the subdistrict administrative organization category, the top two scores of
93.67 and 91.40 were found in the indicators (1) Bribery Fraud and (3) Power Distortion, respec-
tively. In contrast, the lowest average ITA score of 67.11 was observed in the indicator (10) An-
ti-Corruption Practice.
4. The averages of the ITA scores in each organization category were analyzed further to
determine whether the organizations in the category met the assessment criterion of the very
good or A performance level. Details of the number of organizations that passed and failed to
meet the assessment criterion are given next. Table 2 also provides a summary of the analysis.
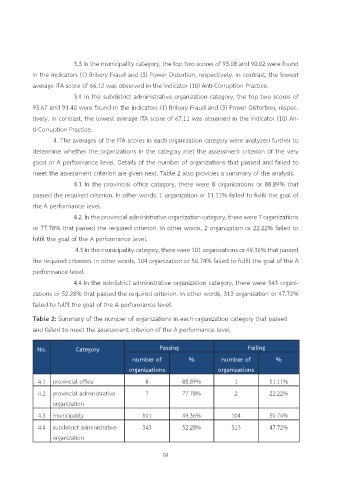
4.1 In the provincial office category, there were 8 organizations or 88.89% that
passed the required criterion. In other words, 1 organization or 11.11% failed to fulfil the goal of
the A performance level.
4.2. In the provincial administrative organization category, there were 7 organizations
or 77.78% that passed the required criterion. In other words, 2 organization or 22.22% failed to
fulfil the goal of the A performance level.
4.3 In the municipality category, there were 101 organizations or 49.36% that passed
the required criterion. In other words, 104 organization or 50.74% failed to fulfil the goal of the A
performance level.
4.4 In the subdistrict administrative organization category, there were 343 organi-
zations or 52.28% that passed the required criterion. In other words, 313 organization or 47.72%
failed to fulfil the goal of the A performance level.
Table 2: Summary of the number of organizations in each organization category that passed
and failed to meet the assessment criterion of the A performance level
No. Category Passing Failing
number of % number of %
organizations organizations
4.1 provincial office 8 88.89% 1 11.11%
4.2 provincial administrative 7 77.78% 2 22.22%
organization
4.3 municipality 101 49.36% 104 50.74%
4.4 subdistrict administrative 343 52.28% 313 47.72%
organization
ณ